 aiFitBalance
What your BMI really means (and the two measurements that complete it)
Team at aiFitBalanceWritten with AI assistance22 min readIn summary
- The BMI is a tool for population screening, not a diagnosis: it divides your weight in kilograms by your height in meters squared and places you in one of the six categories of the WHO (WHO information sheet on overweight and obesity, updated March 1, 2024).
- The same BMI can correspond to two very different bodies, because the formula does not distinguish muscle from fat nor does it look at where that fat is located.
- The two measures that complete it and that you can take at home with a tape measure are the waist circumference (increased risk from 94 cm in men and 80 cm in women, according to the WHO expert consultation report from 2008) and the waist-to-height ratio, which should be below 0.5 (NG246 guideline from NICE, January 2025).
- In January 2025, the Clinical Obesity Commission of The Lancet Diabetes & Endocrinology recommended stopping the use of BMI as the sole criterion and always confirming it with a second body measurement.
- aiFitBalance, the BMI calculator from AIsToHire, does exactly that in six questions: it calculates the BMI, classifies it, adds waist, hip, and neck if you have them, estimates body fat and calories, and saves each measurement so you can see the trend.
You type "BMI calculator" into Google, enter your weight and height, and get a number with a label underneath. That’s where it all ends. The problem starts right after: 27.4 doesn’t tell you what to do on Monday morning. This article explains what the body mass index measures, in what cases it misleads you, what two measures correct it, and how to go from a number to a concrete plan — and how it is resolved by aiFitBalance, the BMI calculator with analysis and personalized plan from AIsToHire, which is the tool we will use as an example throughout the text.
Notice. This article is for informational and educational purposes. It is not medical advice, does not diagnose any disease, and does not replace the assessment of a healthcare professional. If your result concerns you, if you have a pathology, or if you are considering significant changes in diet or exercise, consult your doctor or a registered dietitian-nutritionist.
What is BMI and what does it measure exactly
The body mass index is the quotient of your weight in kilograms and the square of your height in meters: BMI = kg ÷ m². What it measures is how much mass you have in relation to your height, nothing more. It does not measure fat, it does not measure muscle, and it does not measure health: it is an indirect indicator, designed to compare populations, which is then applied to individuals because it is cheap and quick.
The formula is not new. It was proposed by the Belgian statistician Adolphe Quetelet in 1832 as the "Quetelet index" to describe the average man, and it was the physiologist Ancel Keys who renamed it as body mass index in an article in the Journal of Chronic Diseases in 1972, after finding that it was the relative weight index that best correlated with body fat measured by densitometry. Keys, however, warned in that same article that it was useful for population studies, not for diagnosing an individual.
These are the cutoffs used by the World Health Organization for adults:
| BMI (kg/m²) | WHO Category |
|---|---|
| Less than 18.5 | Underweight |
| 18.5 – 24.9 | Normal weight |
| 25.0 – 29.9 | Overweight |
| 30.0 – 34.9 | Obesity grade I |
| 35.0 – 39.9 | Obesity grade II |
| 40.0 or more | Obesity grade III |
Source: World Health Organization, classification of nutritional status in adults; information sheet "Obesity and overweight", updated March 1, 2024.
One detail that almost no calculator resolves well: rounding. If your actual BMI is 24.96, a calculator that rounds to one decimal will show you "24.9" and, if it classifies based on the unrounded value, it labels you as overweight. The number and label contradict each other on the screen. aiFitBalance always classifies based on the value it shows, so what you read and what the label tells you always match.
Does your BMI indicate overweight? This is what that number can and cannot tell you
A BMI of 27 means you weigh more than what the WHO statistically considers optimal for your height. It does not mean you have excess fat, that you are sick, or that you will become sick. The formula only knows two pieces of data about you —weight and height— and with just two pieces of data, it cannot distinguish between a very muscular body, a body with fat distributed around the hips, and a body with fat accumulated in the abdomen, which is the pattern associated with higher metabolic risk.
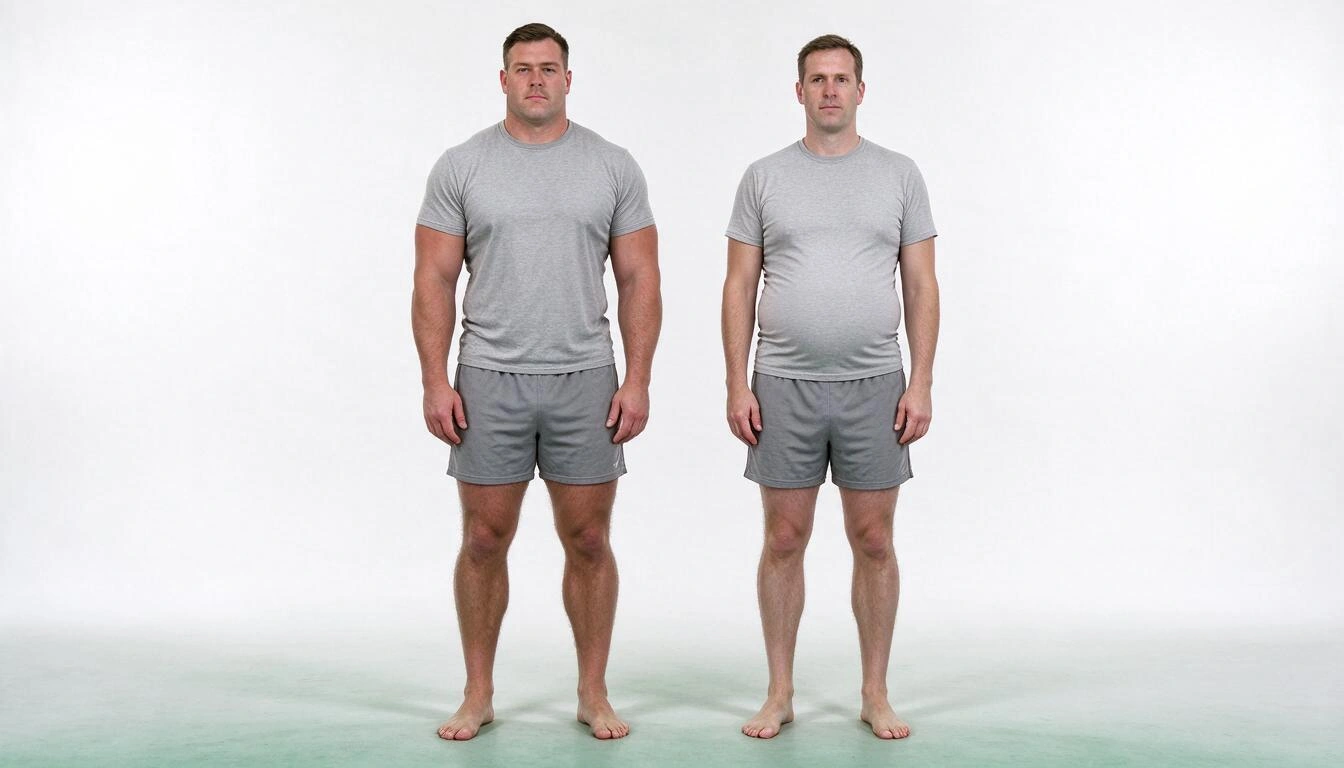
The two men in the photo are the same height and could weigh the same: same BMI, same label, two completely different situations. That is, in one image, the entire limitation of the index.
In January 2025, the Commission on the Definition and Diagnosis of Clinical Obesity published in The Lancet Diabetes & Endocrinology —signed by more than fifty international specialists— was explicit on this point: BMI alone should not be used to diagnose obesity in a specific person and should be confirmed with at least one additional measure of body fat or fat distribution (waist circumference, waist-to-height ratio, or waist-to-hip ratio), except in very high BMIs, where excess adiposity can be assumed. The same Commission proposed separating preclinical obesity (excess adiposity without organ impairment) from clinical obesity (with dysfunction already present).
Summed up in one sentence: BMI is a good first question and a terrible final answer.
And yet it remains useful, because it is free, reproducible, and sufficiently good at the population level. In the WHO European Region, 59% of adults are overweight or obese according to the WHO European Regional Obesity Report 2022 (published on May 3, 2022). That data was obtained using BMI, and no one has a better method for 900 million people.
How much should I weigh for my height: look for the range, not the number
There is no "your ideal weight" as a single figure. What exists is a healthy weight range: the interval of kilos that keeps you within a BMI of 18.5–24.9 for your height. It is calculated by multiplying those two limits by your height in meters squared, and it usually spans an interval of 12 to 20 kilos.
This table saves you the calculation. The last column is the waist limit we will discuss in the next section (half of your height):
| Height | Healthy weight (BMI 18.5–24.9) | Recommended waist below |
|---|---|---|
| 1.55 m | 44.4 – 59.8 kg | 77.5 cm |
| 1.60 m | 47.4 – 63.7 kg | 80.0 cm |
| 1.65 m | 50.4 – 67.8 kg | 82.5 cm |
| 1.70 m | 53.5 – 72.0 kg | 85.0 cm |
| 1.75 m | 56.7 – 76.3 kg | 87.5 cm |
| 1.80 m | 59.9 – 80.7 kg | 90.0 cm |
| 1.85 m | 63.3 – 85.2 kg | 92.5 cm |
| 1.90 m | 66.8 – 89.9 kg | 95.0 cm |
Own calculation based on WHO cut-offs (18.5 and 24.9 kg/m²) and the NICE waist-to-height ratio threshold of 0.5 (NG246, January 2025).
If what you are looking for is a specific figure instead of a range, there are four classic "ideal weight" formulas that are still used in the clinical field, especially for dosing medications: Devine (1974), Robinson (1983), Miller (1983), and Hamwi (1964). aiFitBalance calculates all four and also shows their average and dispersion, which is the interesting data: for the same person, they can vary by 6 or 7 kilos from each other. The fact that four published formulas do not agree is the best proof that "ideal weight" is a convention, not a biological constant.
The two measures that correct the BMI: waist and waist-height ratio
If you are only going to add one measure to the BMI, let it be the waist circumference, because it estimates abdominal fat, which is associated with a higher cardiometabolic risk. And if you are going to add two, the second is the waist-height ratio: divide your waist by your height, in the same units, and the result should be below 0.5.
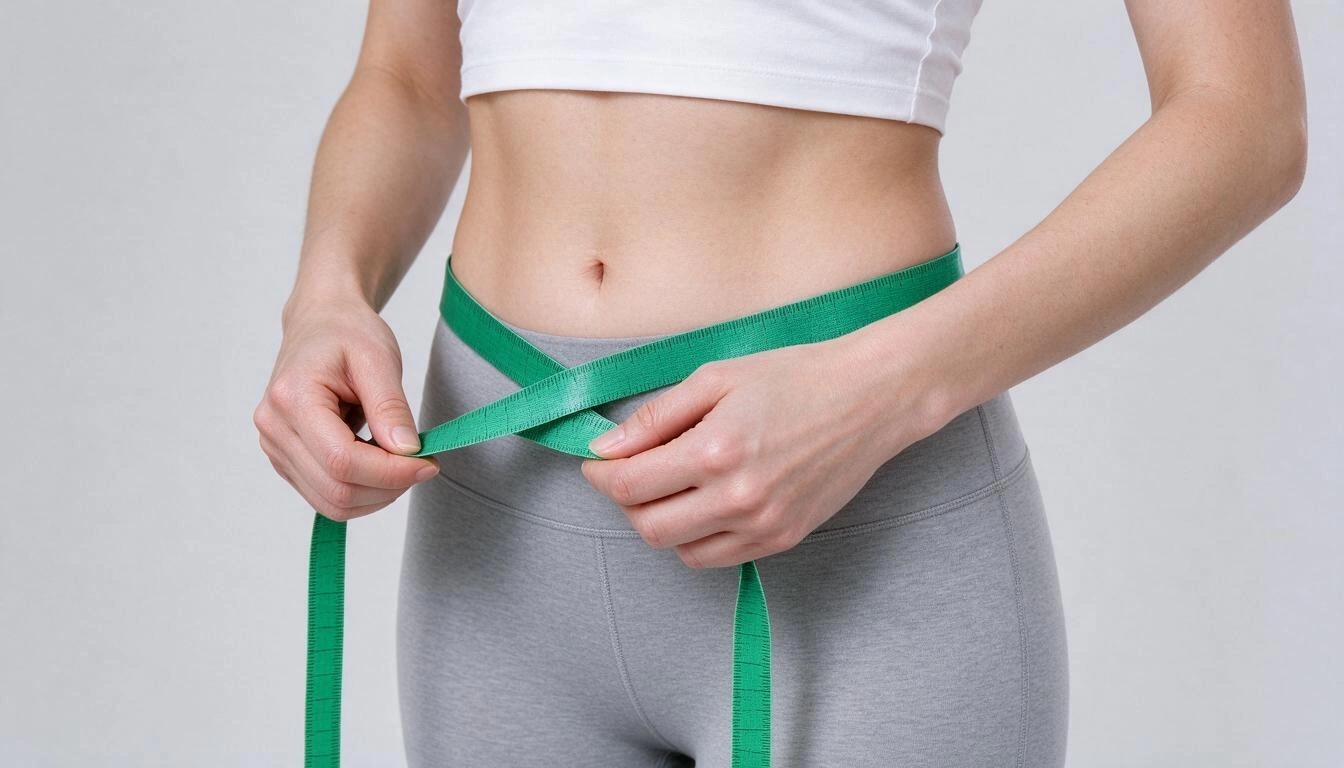
How to measure your waist correctly, which is where almost everyone fails:
- Stand barefoot, with your abdomen exposed and your feet together.
- Locate the midpoint between the lower edge of the last rib and the top of the hip bone (the iliac crest). That is the spot, not the navel or where your pants sit.
- Wrap the abdomen with a flexible measuring tape, horizontally and snug against the skin without tightening or indenting it.
- Measure at the end of a normal exhalation, without sucking in your stomach.
- Always do it at the same time and repeat it twice: if the two measurements differ by more than 1 cm, take a third.
These are the reference thresholds from the WHO, collected in the Report of a WHO Expert Consultation on Waist Circumference and Waist-Hip Ratio (meeting in December 2008, published in 2011):
| Risk Level | Men | Women |
|---|---|---|
| Low risk | Less than 94 cm | Less than 80 cm |
| Increased risk | 94 – 101 cm | 80 – 87 cm |
| Very increased risk | 102 cm or more | 88 cm or more |
And the waist-height ratio, which has the advantage of not depending on sex or tables:
| Waist ÷ height | Reading |
|---|---|
| Less than 0.50 | Within the recommended range |
| 0.50 – 0.60 | Attention zone |
| More than 0.60 | Elevated risk |
The NICE practical rule is easy to remember: your waist should measure less than half your height. The British guideline NG246, Overweight and obesity management, published on January 14, 2025, recommends using the waist-height ratio alongside the BMI for adults with a BMI below 35 kg/m², precisely to avoid misclassifying those with a lot of muscle mass or central fat.
The third measure, the waist-hip ratio, uses the same data plus the hip circumference, and the WHO places the substantially increased risk above 0.90 in men and 0.85 in women.
aiFitBalance calculates all three if you enter waist, hip, and neck (these are optional fields: the BMI works without them), and with those same measurements estimates the body fat percentage using the anthropometric method of the U.S. Navy (Hodgdon and Beckett, 1984). If you don't have the tape handy, it falls back to the Deurenberg (1991) formula, which estimates fat based on BMI, age, and sex. Neither of the two is a real measurement: they are estimation equations with a margin of error of several percentage points compared to a DEXA, and the app displays this on screen.
When the standard BMI is not your table: five situations with different thresholds
The WHO table you saw above is designed for the general adult population of European descent. There are at least five situations where the cutoffs change or do not apply, and using the wrong table is the most common cause of an alarming result without reason or a reassuring result without reason.
| Situation | What changes | Reference |
|---|---|---|
| Asian descent | Overweight from 23 and high risk from 27.5 instead of 25 and 30 | WHO expert consultation, The Lancet, January 2004 |
| Aged 65 and older | A slightly higher range is used (around 23–28) because low weight and sarcopenia weigh more than mild overweight | Common convention in geriatric nutrition; not an official WHO table |
| Very muscular individuals | The BMI overestimates adiposity: it should be read alongside waist and estimated fat | Lancet Commission on Clinical Obesity, January 2025 |
| Pregnancy | The BMI is not interpretable: weight gain is assessed with the pre-pregnancy BMI and is in the realm of the obstetric team | — |
| Ages 2 to 17 | There are no fixed cutoffs: percentiles by age and sex are used (overweight from the 85th percentile and obesity from the 95th, CDC criteria) | CDC, BMI tables by age |
aiFitBalance includes these five cases as modes that can be activated in Settings: Asian, 65 and older, athlete, pregnancy (which disables classification, calories, and fat estimation), and pediatric from ages 2 to 17. Activating them changes the thresholds, the colors of the bar, and the explanatory text. Important and honest: the pediatric percentiles in the app are an approximate CDC-type table, intended to guide, not to replace pediatric follow-up, and the app itself warns of this.
There is also a variant that some very tall or very short people appreciate: the so-called "new BMI" proposed by Nick Trefethen from the University of Oxford in 2013, which uses exponent 2.5 instead of 2 (1.3 × kg ÷ m^2.5) to correct the bias of the classic index at height extremes. aiFitBalance offers it as an optional preference, marked as what it is: an academic proposal, not a health standard.
From a number to a plan: how many calories you need and where they come from
To move from BMI to something actionable, a second formula is needed: the energy expenditure formula. The current standard is Mifflin-St Jeor (Mifflin, St Jeor et al., American Journal of Clinical Nutrition, 1990), which estimates the basal metabolism —the calories you burn at rest— and is multiplied by an activity factor to obtain the total daily expenditure.
The basal metabolism is calculated as follows:
Men:  BMR = 10 × weight(kg) + 6.25 × height(cm) − 5 × age + 5
Women:  BMR = 10 × weight(kg) + 6.25 × height(cm) − 5 × age − 161
And then it is multiplied by the activity factor:
| Activity Level | Factor | Description |
|---|---|---|
| Sedentary | 1.20 | Office work, little or no exercise |
| Light | 1.375 | Light exercise 1–3 days per week |
| Moderate | 1.55 | Moderate exercise 3–5 days per week |
| Active | 1.725 | Intense exercise 6–7 days per week |
| Very active | 1.90 | Physical work or double daily sessions |
Complete example. A 38-year-old man, 92 kg, 178 cm, light activity, aiming to lose weight at a standard pace. These are the numbers returned by aiFitBalance with that data:
| Data | Result |
|---|---|
| BMI | 29.0 → Overweight |
| Healthy weight range for 1.78 m | 58.6 – 78.9 kg |
| Distance to range | 13.1 kg above |
| Basal metabolism (Mifflin-St Jeor) | 1,850 kcal |
| Total daily expenditure (× 1.375) | 2,540 kcal |
| Target calories (500 kcal deficit) | 2,040 kcal |
| Macros (30% P / 40% CH / 30% F) | 153 g protein · 204 g carbs · 68 g fat |
| Estimated time until healthy range | 13 – 26 weeks |
| Guideline hydration | 2.9 L per day |
The daily deficit of 500 kcal is the classic convention corresponding to between 0.5 and 1 kg per week, and it is the pace that the app calls standard (it also offers a gentle one of 250 kcal and an intense one of 750). Two safeguards worth knowing: aiFitBalance never lowers below 1,500 kcal for men or 1,200 kcal for women, and if your BMI is already within the normal range, it automatically limits the deficit to 250 kcal, to avoid pushing you towards unnecessary restriction.
Time estimates are just that, linear estimates. Actual weight does not drop in a straight line: it stagnates, bounces with the menstrual cycle, with salt, and with glycogen. That’s why the trend over eight weeks matters more than the number on Tuesday.
How to measure yourself so that tracking is useful
Most of the frustration with the scale comes from comparing measurements that are not comparable. Your weight can vary between 1 and 2 kilos in a single day due to water, food in the digestive tract, and muscle glycogen, so an isolated measurement means practically nothing: what matters is the series.
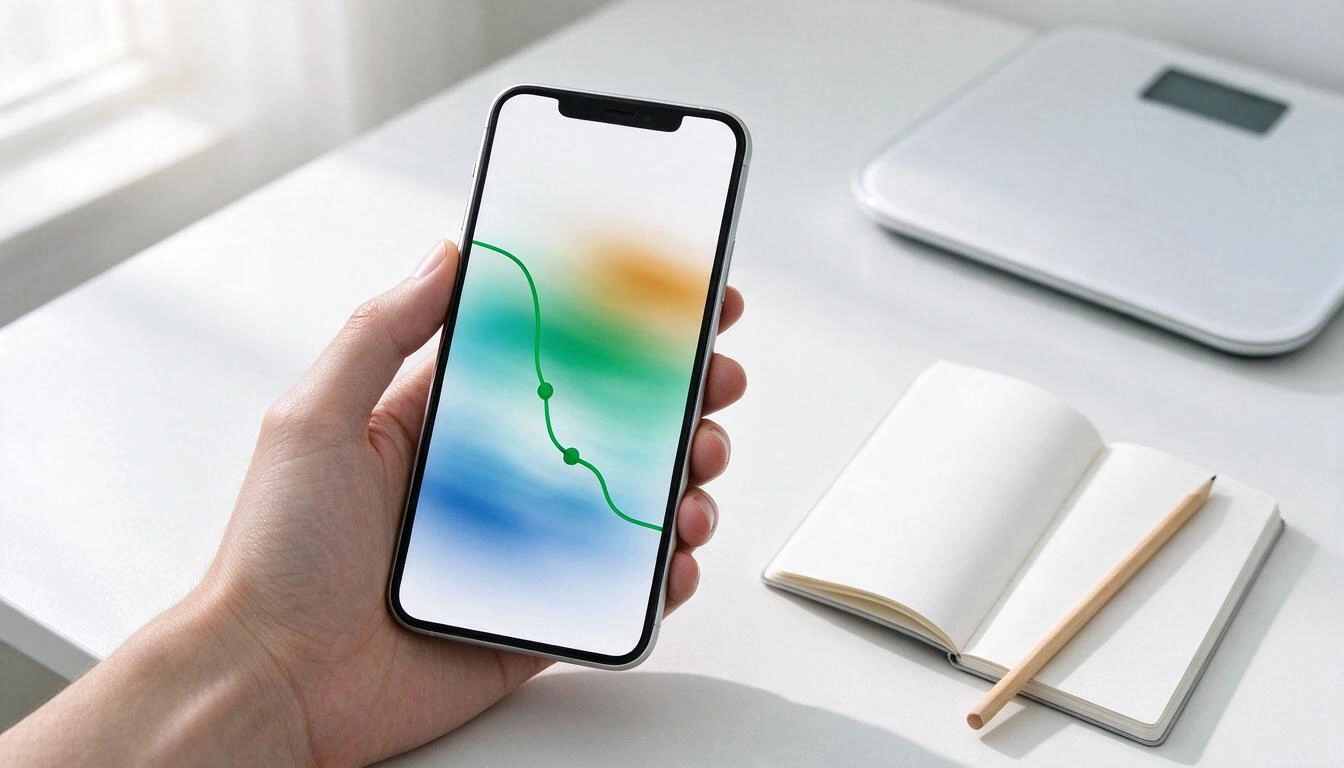
The protocol that makes the data useful:
- Always the same day of the week. Once a week is enough to see trends; daily only if the noise does not affect you emotionally.
- Always at the same time, ideally in the morning, after going to the bathroom and before breakfast or drinking.
- Always with the same clothes (or none) and on a hard surface, never on carpet.
- The same scale. Two different scales can systematically differ by half a kilo.
- Waist, once a month. It changes more slowly than weight, but it is the measure that best reflects what you are changing inside.
- Judge the trend, not the point. Compare the average of the last four weeks with the average of the previous four.
aiFitBalance saves each measurement with its date, weight, height, BMI, category, and any optional measurements you have entered —up to 500 measurements per user— and charts the evolution in a graph with the colored bands of each background category, along with the comparison between your first and last measurement and your average change per week. The history can be exported in CSV, printed as a PDF report, and downloaded as an image card to share.
How aiFitBalance does all this in six questions
aiFitBalance is a step-by-step assistant: one question per screen, no long forms. The six questions are biological sex, age, weight, height, activity level, and goal, and when you finish, you get the complete result. From the second calculation onward, the profile is saved and updating your weight takes two taps.
This is what appears after those six answers:
- The number and category, with a bar that places your result between underweight and obesity, and a plain language explanation of what that category means and what risks are associated with it.
- Your healthy weight range for your height and how many kilos you are from it, plus the ideal weight according to the four classic formulas, the BMI Prime (your BMI divided by 25), and your approximate percentile compared to the population of your sex and age.
- Optional measurements: if you add waist, hip, and neck, it calculates estimated body fat, waist-to-hip ratio, and waist-to-height ratio with its risk reading.
- Calories and macros: basal metabolism, total expenditure, target calories according to your goal and pace, and the distribution of proteins, carbohydrates, and fats in percentage and grams.
- A five-step plan with one action for nutrition, one for exercise, one for habits, and a realistic weight goal for the next month, which you mark as you achieve them.
- Medical consultation warnings when appropriate: BMI below 16 or above 35, waist at very high risk, underweight in those over 65 years old, weight goals that would fall below BMI 18.5 or a variation of more than 5% in weight in less than a month.
- History and evolution, with CSV export, printable report, and shareable card.
All calculations occur in your browser, with the formulas you have seen in this article. You can work in kilos and centimeters or in pounds, feet, and inches, and change units at any time. There is also a personalized analysis written with AI, but it is optional: the app is complete without it, because all texts and recommendations are deterministic.
What aiFitBalance does not do (and it's good to know before you start)
No BMI calculator diagnoses anything, and this one doesn’t either. aiFitBalance is an educational and self-monitoring tool: it calculates, classifies according to published criteria, explains, and alerts you when it’s advisable to consult a professional. That’s where it ends.
Specifically, it does not do any of the following:
- It does not issue diagnoses or medical guidelines, nor does it replace your doctor, your dietitian-nutritionist, or your obstetric team.
- It does not prescribe diets or individualized training plans: recommendations are general and based on categories and your responses.
- It does not connect to smart scales, watches, or activity bracelets: all data is entered by you.
- It does not measure body fat: it estimates it with anthropometric equations, with the margin of error that this implies.
- It does not send push notifications or reminders to your mobile outside of the app itself.
- The percentile tables —both the adult population and pediatric— are approximate guidelines, and this is indicated on the screen.
If any result concerns you, the right decision is not to repeat the calculation with another calculator: it is to take it to a consultation.
FAQ
What is the normal BMI for my age?
The WHO does not publish BMI ranges by age for adults: from 18 years onward, the normal weight range is 18.5–24.9 for all ages. Age does influence other factors that the app does calculate (basal metabolism decreases with age and the estimation of body fat using the Deurenberg formula includes age). From 65 years onward, many geriatric nutrition protocols manage a slightly higher range, around 23–28, because in that range, low weight and muscle loss pose a greater risk than mild overweight; aiFitBalance offers it as an optional mode. In individuals under 18 years, BMI is not interpreted with fixed cutoffs but with percentiles by age and sex.
What BMI is considered obesity?
From 30.0 kg/m² according to the WHO classification, divided into three degrees: obesity I from 30 to 34.9, obesity II from 35 to 39.9, and obesity III from 40 and above. In populations of Asian descent, the WHO expert consultation published in The Lancet in January 2004 set the high-risk point at 27.5. And remember what the Lancet Commission said in January 2025: below a BMI of 35, that number should be confirmed with a measure of fat distribution before discussing obesity in a specific person.
I have a BMI of 27 but I lift weights three days a week, do I have overweight?
BMI indicates that your mass is high for your height; it does not specify what it is made of. In individuals with a lot of muscle mass, it is common for the index to overestimate adiposity and classify them as overweight without excess fat. The home check is immediate: measure your waist. If it is below 94 cm (men) or 80 cm (women) and your waist-to-height ratio is less than 0.5, the 27 is probably muscle and not fat. aiFitBalance has an athlete mode that nuances the overweight reading and prioritizes waist and estimated fat over the BMI label.
How much should my waist measure?
The simplest rule is that of NICE (NG246, January 2025): less than half your height. If you are 1.70 m, below 85 cm. The absolute thresholds from the WHO, from the 2008 expert consultation report, are 94 cm in men and 80 cm in women for increased risk, and 102 and 88 cm respectively for very increased risk. Measure at the midpoint between the last rib and the iliac crest, with the tape horizontal and at the end of a normal exhalation.
How many kilos can I lose per month without overdoing it?
The pace considered sustainable and the one used by aiFitBalance by default corresponds to a deficit of about 500 kcal daily, which roughly corresponds to between 0.5 and 1 kg per week. The app also offers a gentle pace (250 kcal) and an intense one (750 kcal), and in no case does it go below 1,500 kcal daily for men or 1,200 for women. If your BMI is already in the normal range, it automatically limits the deficit to 250 kcal. Any plan below those minimums should be supervised by a healthcare professional.
Is BMI useful for children and adolescents?
It is useful, but it is read differently. Between the ages of 2 and 17, BMI is compared with percentile tables by age and sex, because body composition changes with growth: according to CDC criteria, the 85th percentile marks overweight and the 95th marks obesity. aiFitBalance includes a pediatric mode for ages 2 to 17 with a rough table of that kind, useful for guidance, but monitoring growth belongs to the pediatrician, who works with the complete curves of the child.
Do I need a smart scale or to connect a watch to use it?
No. aiFitBalance works in the browser and all data is entered by you: weight, height, age, sex, activity, and goal, plus waist, hip, and neck if you want the expanded analysis. It does not connect to scales, watches, or activity bands, nor does it need to: a normal scale and a 150 cm sewing tape measure are sufficient.
Are my measurements saved and can I retrieve them?
Yes. Each measurement is saved in your account with its date, and the app also keeps a local copy on the device so you can consult your history even if you lose connection. The limit is 500 measurements; you can edit or delete any of them, clear the entire history, and export it in CSV or as a printable report whenever you want.
Is BMI worth anything then, or is it better to ignore it?
It is worth a lot, as long as you treat it for what it is: a first free filter. It is the best tool available to decide if it is worth looking further. If your BMI is between 18.5 and 24.9 and your waist measures less than half your height, you have a reasonably reassuring signal with two minutes of work. If it falls outside that, what you have gained is not a diagnosis: it is a reason to measure the waist, look at the trend over a few weeks, and, if necessary, make an appointment.
aiFitBalance is the BMI calculator from AIsToHire: in six questions, it calculates your body mass index with the WHO ranges, your healthy weight range, your estimated body fat based on waist, hip, and neck, your calories and macros, and saves each measurement with its evolution graph so you can read the trend instead of the noise. It is available at aiFitBalance — BMI Calculator with Analysis and Personalized Plan, works in the browser without installing anything, and is an educational tool: it does not diagnose or replace the assessment of a healthcare professional.
Calculate your BMI with aiFitBalance and get the missing context: your healthy weight range for your height, your waist measured against WHO thresholds, your calories and macros, and a five-step plan. It’s six questions, works in the browser, and requires no installation.
Calculate your BMI with aiFitBalance and get the missing context: your healthy weight range for your height, your waist measured against WHO thresholds, your calories and macros, and a five-step plan. It’s six questions, works in the browser, and requires no installation.Keep reading
View all articles →
Preclinical obesity and clinical obesity: how the definition has changed (and what to do with your BMI)

Discussing via WhatsApp or talking in person: what science says about couple conflicts through messages
Mind map, concept map, and outline: differences and when to use each one