 aiDraw
How to Create a Flowchart Step by Step: Symbols, Rules, and Common Mistakes That Make It Unreadable
Team at aiDrawWritten with AI assistance19 min readIn summary
- A well-made flowchart is understood with six shapes: start/end capsule, process rectangle, decision diamond, data parallelogram, wavy document rectangle, and connector circle. Everything else is optional.
- The symbols are not decoration: they are standardized in ISO 5807:1985, which is the successor to ANSI X3.5-1970. ISO has never replaced it, so it remains the reference cited in manuals.
- The rule that saves the most diagrams: one input and one output per shape, reading from top to bottom or left to right, and connectors that do not cross. A diamond without its two labeled outputs is a broken diagram.
- If the process is going to be read by people outside your team (audit, client, supplier), the business standard is BPMN 2.0 (OMG, January 2011; adopted as ISO/IEC 19510:2013), not the classic flowchart.
- aiDraw, the mini drawing and diagram app from AIsToHire, runs in the browser: a flowchart template already connected, connectors that anchor to shapes and recalculate when moved, and export to PNG, JPG, SVG, PDF, or JSON.
Making a flowchart seems trivial until you teach it: half the time the discussion is not about the process, but about what that diamond means, why there are three arrows coming out of a box, or where the flow ends. This guide is about the opposite: the shapes you really need, the order in which it’s best to draw them, the rules that make it understandable to someone else without you explaining it, and how to draw it without installing anything with aiDraw, the infinite canvas design and diagram editor from AIsToHire.

What is a flowchart and when is it worth making one
A flowchart is the graphical representation of a process as a sequence of steps connected by arrows, where each shape has a fixed meaning and each arrow indicates the order in which things occur. It serves a very specific purpose: to convert a process that exists in someone’s head (or spread across three emails) into something that can be reviewed, discussed, and corrected by pointing.
It is worth doing when at least one of these conditions is met:
- There are decisions. If the process is a linear list of steps, a numbered list is better than a diagram. The diagram wins when the first "if X happens, then…" appears.
- It has to be executed by someone else. A process that only you do does not need a diagram; one that you are going to delegate does.
- You want to find the hole. Drawing a process forces you to close all paths. Gaps (a diamond with a single output, a step without an end) appear on their own.
- You are going to program it or automate it. The diagram is the cheap prior specification: changing an arrow takes ten seconds, changing the code does not.
And when it does not pay off: if the process has more than 25 or 30 steps, a single diagram becomes unreadable. The correct approach then is to break it into a high-level diagram with 5-8 boxes and a diagram for each box (what ISO 5807 calls a predefined process).
The symbols of a flowchart and what each one means
The symbols of a flowchart are standardized: ISO 5807:1985 (Information processing — Documentation symbols and conventions for data, program and system flowcharts) includes the set of shapes that the American standard ANSI X3.5-1970 previously defined. ISO maintains it published and has never issued a standard to replace it, which is why in 2026 it will still be the reference cited by manuals and templates.
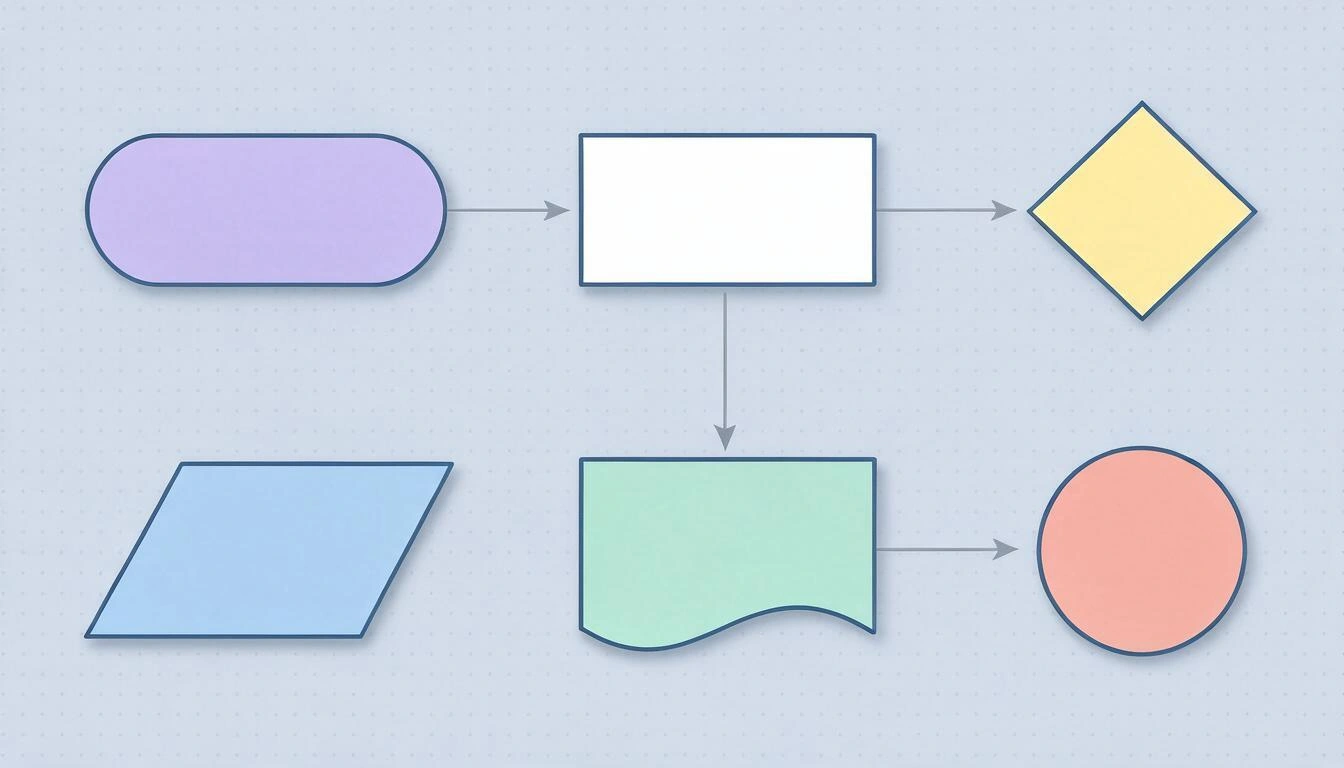
With these six shapes, almost all real processes are drawn:
| Shape | Name | What it means | Example label |
|---|---|---|---|
| Capsule / oval | Terminal | Start or end of the process | Start, Order delivered |
| Rectangle | Process | An action that is performed | Validate payment |
| Diamond | Decision | A question with a closed answer | Is there stock? |
| Parallelogram | Data (input/output) | A data point that enters or exits the process | Form received |
| Wavy rectangle | Document | A document that is generated or read | Invoice in PDF |
| Small circle | Connector | Jump to another point in the same diagram or to another page | A |
There is a second group of shapes that you will often see and that you do not need to start. Use them only when they add value:
| Shape | Name | When to use it |
|---|---|---|
| Rectangle with two vertical bands | Predefined process / subprocess | The step is, in turn, another complete diagram |
| Cylinder | Database | It needs to be clear where the data is stored |
| Rectangle with the corner folded | Note / annotation | Clarification that is not part of the flow |
| Elongated pentagon | Off-page connector | The flow continues on another sheet |
| Inverted triangle | Storage / file | Physical and logistical processes |
Practical rule: if you have to explain what a shape means, don’t use it. A rectangle with a clear label communicates better than an exotic symbol that only you know.
How to create a flowchart step by step
Order matters: writing first and drawing later saves half the work. Here are the seven steps, in the order they should be taken.
- Write the process in a list, in short sentences. "The user fills out the form. The email is validated. If the email is not valid, an error is shown. If it is valid, the account is created and the welcome email is sent." This is your script.
- Mark the start and the end (or ends). Every diagram has exactly one start. It can have several ends, but each path must end in one: a path that is left hanging is the number one error.
- Separate actions from decisions. Each sentence in your list is a rectangle or a diamond. If a sentence contains a "if" or "when", it almost certainly hides a diamond that you haven't written yet.
- Draw the main column, the happy path. First, the path where everything goes well, from top to bottom, in a single column. No branches.
- Hang the branches to the sides. Exceptions and error paths come out to the right and left of the column, not interrupting it. This way, the reader sees the normal process at a glance.
- Label all the exits of the diamonds.
Yes/No, orApproved/Rejected. A diamond with unlabeled arrows cannot be read. - Walk through the diagram as if you were a data point. Enter at the start and follow each arrow to an end. If you reach a shape from which you don’t know how to exit, or end up in a loop with no exit condition, there lies the fault.
A complete example, from start to finish
Process: registering a customer on a website.
- List: the visitor fills out the form → the email is validated → if it is not valid, error and return to the form → if it is valid, the account is created → the welcome email is sent → end.
- Start: capsule
Visitor on the registration page. End: capsuleActive account. - Actions (rectangles):
Fill out form,Create account,Send welcome email. Decision (diamond):Is email valid?. - Main column: start → fill out form → is email valid? → create account → send email → end.
- Branch: from
Is email valid?goes leftNo→ rectangleShow error→ arrow back toFill out form. - Labels:
Yesdown,Noleft. - Path: both paths end in
Active accountor return to the form. There are no loose ends.
There are nine shapes. That is the size at which a flowchart works.
The seven rules that separate a readable diagram from a scribble
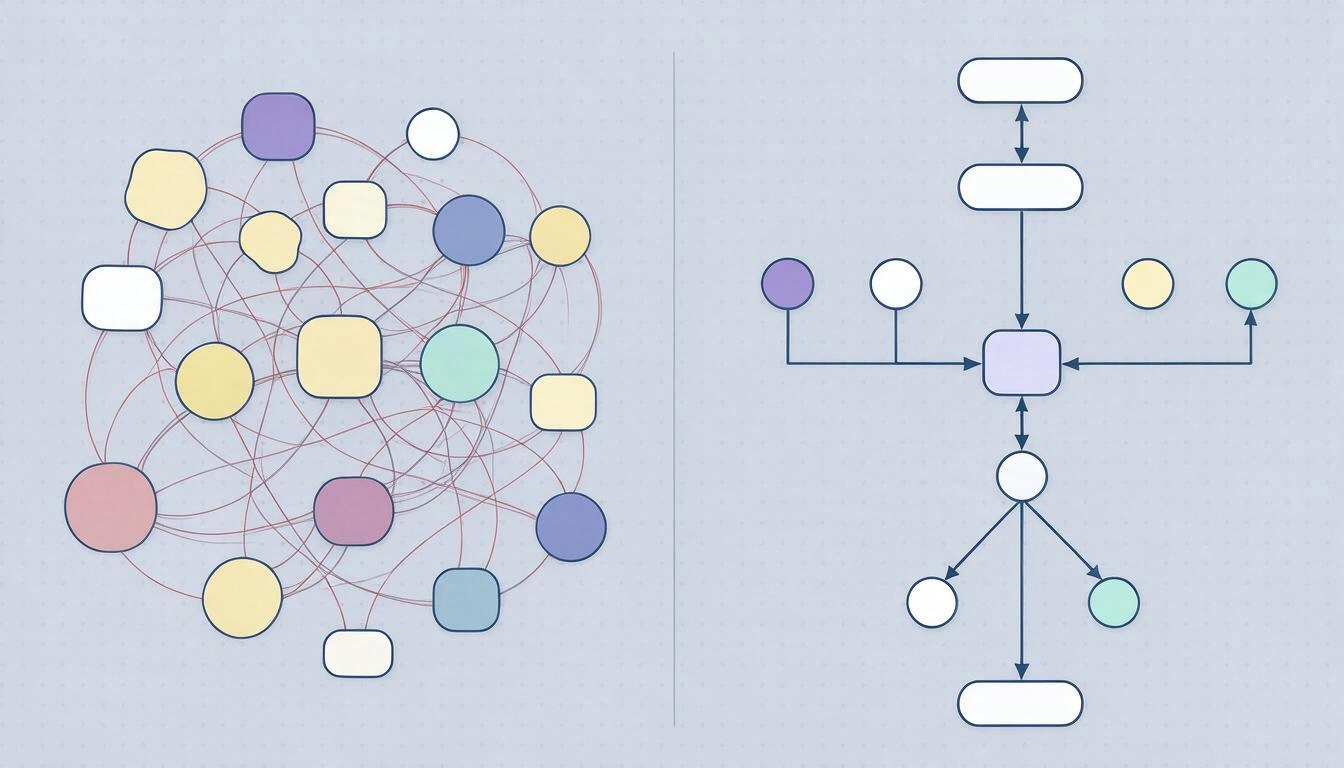
The difference between a diagram that is understood and one that is not is almost never in the shapes: it is in the layout. These seven rules are the ones that need to be remembered most often during a review.
- One reading direction, always the same. From top to bottom or from left to right. Mixing the two in the same diagram forces the reader to search for where to continue.
- One entry and one exit per shape (except the diamond, which has one entry and two or three exits). If a box has four arrows coming in from different places, use a connector circle.
- Lines do not cross. If they cross, reorder the boxes or use labeled connectors. A crossing is a visual ambiguity.
- Right angles, not diagonals. Orthogonal lines are followed by the eye much better than diagonals, especially when there are several together.
- All boxes the same size and aligned to a grid. Differences in size are interpreted by the reader as differences in importance, even if you do not intend to convey that.
- Labels of 2 to 5 words, starting with a verb.
Validate payment, notValidationorHere the system checks that the payment gateway has returned a correct response. - Between 5 and 15 shapes per diagram. Above 25, the diagram ceases to be helpful. Miller described in 1956 (The Magical Number Seven, Plus or Minus Two, Psychological Review) that working memory handles about seven items at a time; this is not a law about diagrams, but it explains well why one with forty boxes is not "seen", it is studied.
The errors that force you to redo the diagram
Almost all diagrams that need to be redone fail for the same five reasons. Review this table before considering it good.
| Error | Why it breaks the diagram | How to fix it |
|---|---|---|
| Diamond with a single exit | It is not a decision, it is a step: the reader looks for the other branch and cannot find it | Turn it into a rectangle or add the missing exit |
| Path that does not end | The reader does not know if the process ends there or if something is missing | Every branch ends in an end capsule or connects to another branch |
Noun labels (Validation) | It is not clear who does what or if it has already occurred | Verb + complement: Validate payment |
| Loop without exit condition | In a real process, it is a blockage; in an automated one, an infinite loop | Every loop returns to a diamond that can cut it |
| Mixing levels of detail | One box says Invoice and the one next to it Press the Save button | Raise the fine detail to a separate subprocess |
Flowchart, BPMN or activity diagram: which one is for you
It depends on who is going to read it. The classic flowchart is for internal use and for thinking; BPMN is for business processes that cross departments or companies; the UML activity diagram is for documenting software.
| Flowchart | BPMN 2.0 | UML Activity | |
|---|---|---|---|
| Standard | ISO 5807:1985 (from ANSI X3.5-1970) | OMG BPMN 2.0, January 2011; ISO/IEC 19510:2013 | OMG UML 2.5.1, December 2017 |
| For whom | Anyone, no prior training | Business analysts, auditing, suppliers | Development teams |
| Figures to know | 6 | More than 50 | About 15 |
| Participants | Does not represent them | Lanes and pools by role or organization | Partitions (swimlanes) |
| Parallelism | Does not express it well | Yes, with gateways (gateways) | Yes, with fork bars |
| Learning curve | Minutes | Days | Hours |
If in doubt, start with the flowchart. It's the only one that everyone reads without a manual, and moving from a correct flowchart to BPMN later is mechanical; the other way around, information is lost.
How to create the diagram in aiDraw: three paths
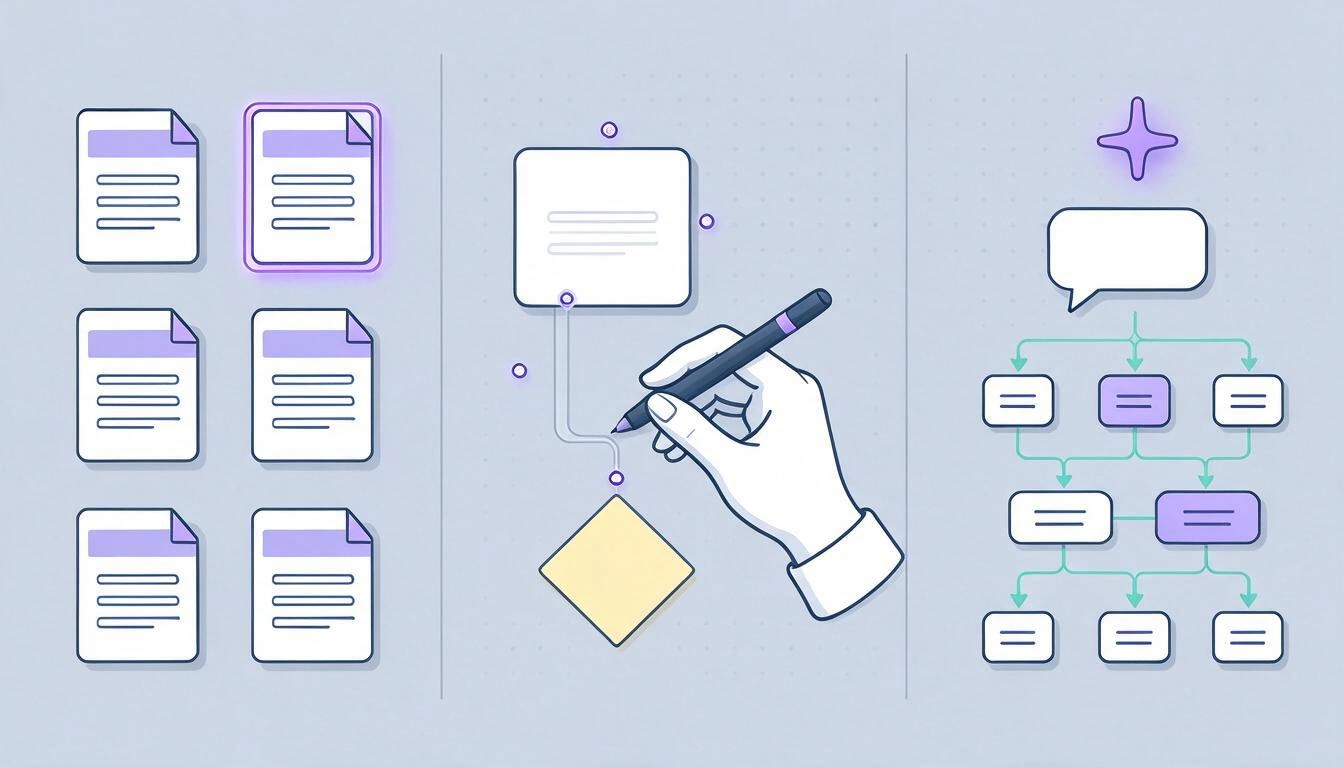
In aiDraw, there are three ways to arrive at the same diagram, and they can be mixed: starting from a template, drawing it by hand with anchored connectors, or describing it in text and letting the AI create it for you to refine later. Everything happens in the browser, with no installation required, on an infinite canvas with zoom from 2% to 6400%.
Path 1 — Start from the template
In the Templates tab, there are six starting points: blank, flowchart, web wireframe, brainstorming, Kanban board, and system architecture. The flowchart template comes with the starting capsule, a process rectangle, a decision diamond, and two outputs, all connected with real connectors. The norm is to change the labels and add two or three boxes: in five minutes, you have the diagram from the example above.
Path 2 — Draw it by hand with anchored connectors
This is the part that makes the difference compared to drawing in a generic tool:
- The basic figures have shortcuts:
Rfor rectangle,Ofor ellipse,Gfor polygon (with four sides it is the diamond),Tfor text,Sfor sticky note,Cfor connector. - With the connector active, each figure shows four anchors (top, right, bottom, and left). The pointer hooks to the anchor when it is within 14 px, so no precision is needed.
- An anchored connector is not a loose line: it keeps track of which figure it is attached to at each end. If you move a box, the connector recalculates itself. This allows you to reorder an entire diagram without redrawing a single arrow.
- Each connector supports three paths: orthogonal (the one required by rule 4), straight, and curved.
- The smart guides align the new box with the existing ones, and the snap to grid keeps the sizes equal (rules 5 and 4).
- If you prefer to draw freehand, the shape recognition mode turns the scribble into a clean figure, and the handwriting tool transcribes to text what you write with the pencil.
Path 3 — Describe it in text and let the AI create it
In More → Diagram from text, you write the process in natural language and aiDraw draws it on the canvas. A prompt that works well is literally the script from step 1:
Creating a customer on a website: the visitor fills out the form,
the email is validated; if it is not valid, an error is shown and it goes
back to the form; if it is valid, the account is created, a welcome
email is sent, and it ends.
What it generates and what it does not:
- It generates between 3 and 18 nodes (the hard limit is 24 nodes and 48 connections), with four types of figures: rectangle, ellipse, diamond for decisions, and sticky note.
- The connections are created as anchored orthogonal connectors to the figures, and those that have labels (
Yes,No) paint them as text on the arrow. - The result is an editable diagram, not an image: each box can be moved, renamed, and recolored like any other.
- It is not an illustration generator. aiDraw does not draw photos or drawings: the AI builds the structure and you do the fine drawing.
It makes sense to use the AI as a first draft and then apply the seven rules: you almost always need to reorder two boxes and label some output.
Shortcuts that save more time
| Shortcut | What it does |
|---|---|
V / H | Selection / move the canvas |
R O G T S C | Rectangle, ellipse, polygon, text, note, connector |
Ctrl+D | Duplicate selection (or Alt+drag) |
Ctrl+G / Ctrl+Shift+G | Group / ungroup |
Ctrl+1 | Fit zoom to content |
Ctrl+0 | Return to 100% |
[ / ] | Send to back / bring to front |
Ctrl+Z | Undo (up to 50 steps) |
| 2 fingers | Move and zoom on touch, always, even when drawing |
The document saves automatically while you work (auto-save every 1.2 s after the last action) and, if the network goes down, it leaves a copy on the device that offers to recover when you reopen it. You can also save up to 20 named versions per document and return to any of them.
In what format to export the diagram depending on where it will end up
Choose the format based on the destination, not out of habit. In aiDraw, the export dialog offers five formats and allows you to export the entire document, only the selected part, or an area that you draw with a box.
| Destination | Format | Recommended settings |
|---|---|---|
| Text document, email, presentation | PNG at 2x | Transparent background if you paste it over color |
| Web or blog | PNG at 1x or 2x | 2x if the reader can zoom in |
| Printing or poster | SVG | It is the only true vector: scales without losing sharpness |
| Send for signing or archiving | One page, no selectable text | |
| Continue editing on another device or save a copy | JSON | It can be imported back into aiDraw with More → Import JSON |
| Quick paste in another app | Copy as image / as SVG | Goes directly to the system clipboard |
Two honest nuances about exporting:
- The PDF from aiDraw is a page with the diagram rasterized (an embedded JPEG image at the resolution you choose: 1x, 2x, or 4x). It works perfectly for sharing and archiving, but does not include selectable text or vectors. If you are going to print or need to edit the file in Illustrator or Inkscape, export as SVG.
- The transparent background is only available in PNG and SVG. JPG and PDF always have a white background.
What aiDraw does not do
It is good to know this before starting, so you don't discover it halfway through a project:
- There is no real-time collaboration. It is a single-user editor: there are no multiple cursors on the same canvas or team comments.
- It does not import PDF. You can import JSON documents from aiDraw itself and images (PNG, JPG), but you cannot open a PDF to edit it.
- It does not export video or animations.
- It does not generate illustrations or photographs with AI. Its three AI uses are specific: diagram or wireframe from text, handwriting transcription, and name suggestions for layers.
- It does not work offline. It saves a local emergency copy if the network fails while you work and retrieves it when you return, but it is not an offline app.
For drawing, diagramming, and exporting, however, it requires nothing installed: it works on computer, tablet, and mobile, and on tablet, you can draw with a digital pen —with pressure sensitivity— while your finger moves the canvas.
Frequently Asked Questions
How do you create a flowchart step by step?
First, write the process as a list of short phrases; mark the start and the end; convert each phrase into a rectangle (action) or a diamond (decision); draw a single column from top to bottom for the path where everything goes well; hang exceptions to the sides; label all the outputs of the diamonds (Yes / No); and traverse the entire diagram following the arrows to check that no path is left hanging. Seven steps, and the first three are about writing, not drawing.
What does each symbol in a flowchart mean?
The capsule or oval is the start or the end; the rectangle is an action; the diamond is a decision with two or three outputs; the parallelogram is data that enters or exits; the wavy base rectangle is a document; and the small circle is a connector that jumps to another point in the diagram. They are defined in ISO 5807:1985, which is a descendant of ANSI X3.5-1970.
How many symbols do I really need?
Six. With capsule, rectangle, diamond, parallelogram, document, and connector, you can draw practically any process. The rest of the catalog (subprocess, database, off-page connector, file) is only worth it if your reader already knows it; if you have to explain a figure, change it for a rectangle with a clearer label.
Can I create a flowchart online without installing anything?
Yes. aiDraw works in the browser, on computer, tablet, and mobile, with a pre-built flowchart template and connectors that anchor to the figures. It is available at aiDraw — Design editor with infinite canvas and you start by creating a free account.
Can AI create the flowchart from a description?
Yes, in More → Diagram from text: you describe the process in natural language and aiDraw draws it as an editable diagram, with diamonds for decisions and orthogonal connectors anchored. It generates between 3 and 18 nodes (hard limit of 24 nodes and 48 connections). Treat it like a draft: it’s common to reorder a couple of boxes and review the labels of the outputs.
In what format should I export the diagram to make it look good?
PNG at 2x for pasting into a document, a presentation, or an email; SVG if it’s going to print or if someone needs to edit it in another vector program; PDF for sharing and archiving; and JSON if you want to keep editing it later in aiDraw. Watch out for the PDF: in aiDraw it is a page with the rasterized diagram, without selectable text.
How many boxes can a flowchart have?
Between 5 and 15 can be read at a glance; beyond 25 it stops working as a communication tool. When you go beyond that, split the diagram: one general with 5-8 boxes and a separate diagram for each box that hides a complete process (what ISO 5807 calls a predefined process).
Flowchart or BPMN?
Flowchart if you are going to use it within your team or to think through the process: six figures and no one needs training. BPMN 2.0 (OMG, 2011; ISO/IEC 19510:2013) if the process crosses departments or companies, you need to represent who does what in lanes, and there are parallel tasks. Transitioning from a correct flowchart to BPMN is mechanical; the other way around, information is lost.
Is work lost if the connection is cut while I’m drawing?
No. aiDraw automatically saves every 1.2 seconds after the last action, and if the save fails due to the network, it leaves a copy on the device that offers to recover when reopening the document and retries when the connection returns. Additionally, you can save up to 20 named versions per document and return to any of them.
Can I draw the diagram by hand with the tablet pen?
Yes. With shape recognition mode enabled, the scribble turns into a clean figure, and the handwriting tool transcribes to text what you write with the pen. On touch devices, two fingers always move and zoom even while you’re drawing, and there’s an option for the finger to navigate and only the pen to draw.
aiDraw is the mini app from AIsToHire for drawing, diagramming, and prototyping on an infinite canvas within the browser, with a flowchart template, connectors that anchor to the figures and recalculate when moved, generating diagrams and wireframes from text with AI, and exporting to PNG, JPG, SVG, PDF, and JSON. It is available at aiDraw — Design editor with infinite canvas.
Open aiDraw in your browser, start from the flowchart template, and have your process drawn, reviewed, and exported in PNG, SVG, or PDF without installing anything. Create your free account and start drawing.
Open aiDraw in your browser, start from the flowchart template, and have your process drawn, reviewed, and exported in PNG, SVG, or PDF without installing anything. Create your free account and start drawing.Keep reading
View all articles →
AI Whiteboards in 2026: What Artificial Intelligence Really Does on an Infinite Canvas (and What Still Remains Your Job)

Why Your Car Insurance Increased in 2026: Average Premium of €1,412 and Historic Record

Discussing via WhatsApp or talking in person: what science says about couple conflicts through messages