 FlowBoard
Flowchart Symbols: What Each One Means and How to Draw Yours Step by Step
Team at FlowBoardWritten with AI assistance18 min readIn summary
- With 8 symbols (terminator, process, decision, data, document, storage, predefined process, and connector) 95% of the flowcharts needed in a company can be drawn. The rest are embellishments.
- The diamond is the only symbol that branches: one input, two or more outputs, and all labeled. If there is a fork without a diamond, the diagram is wrong.
- The international reference is the standard ISO 5807:1985, published in 1985 and still listed as current in the ISO catalog (consulted in October 2026); the symbols come from the U.S. standard ANSI X3.5-1970, which is now withdrawn.
- There is a shortcut that saves half an hour: writing the diagram in text using Mermaid syntax and letting the tool draw and place it automatically.
- FlowBoard, the infinite whiteboard from AIsToHire, brings those 8 symbols as native shapes, imports and exports Mermaid,
.drawio, and.vsdx, and exports to PNG, SVG, PDF, and JSON. What it does not do: simultaneous editing by multiple people on the same board.
If you have arrived here searching for "what does the diamond mean in a flowchart" or "how to make a flowchart", this article answers both: first the table of symbols with their exact meanings, then the composition rules and a complete step-by-step example. In the end, you will see how to draw it without struggling with the mouse in FlowBoard, the infinite whiteboard for diagrams from AIsToHire, which is the tool used to create the examples.
What is a flowchart and when is it worth making one
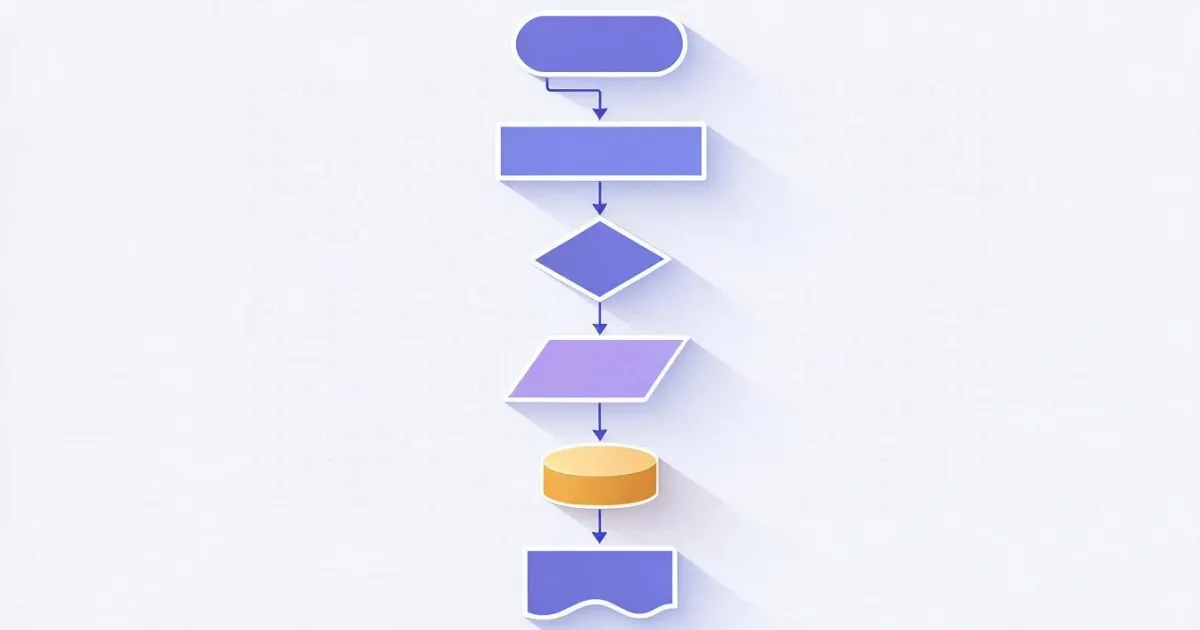
A flowchart is the graphical representation of a process step by step and in order, where each geometric figure signifies a different type of action and the arrows indicate what happens after what. Its value is not in the drawing: it lies in forcing you to decide what happens at each fork, something that a prose document allows you to leave unfinished.
It is worth making when at least one of these conditions is met:
- The process has decisions (if A happens do X, if not, do Y). Without decisions, a numbered list is better and faster to read.
- It is executed by multiple people or systems and there are transfers between them.
- Someone new needs to be trained and the knowledge is in the heads of two people.
- You are going to automate the process and need to present it to the person who will program it.
It is not worth it when the process is linear and has five steps, when it changes every week (maintaining it costs more than it contributes), or when what you really want is to explore ideas: for that, a mind map or a brainstorming session with sticky notes is useful, not a flowchart.
The symbols of a flowchart, one by one
A standard flowchart uses eight symbols. Each shape has a fixed meaning, and that is precisely the point: whoever reads it knows what to expect before reading the text inside. This is the complete correspondence, with the name each shape has in FlowBoard and its equivalence in Mermaid syntax.
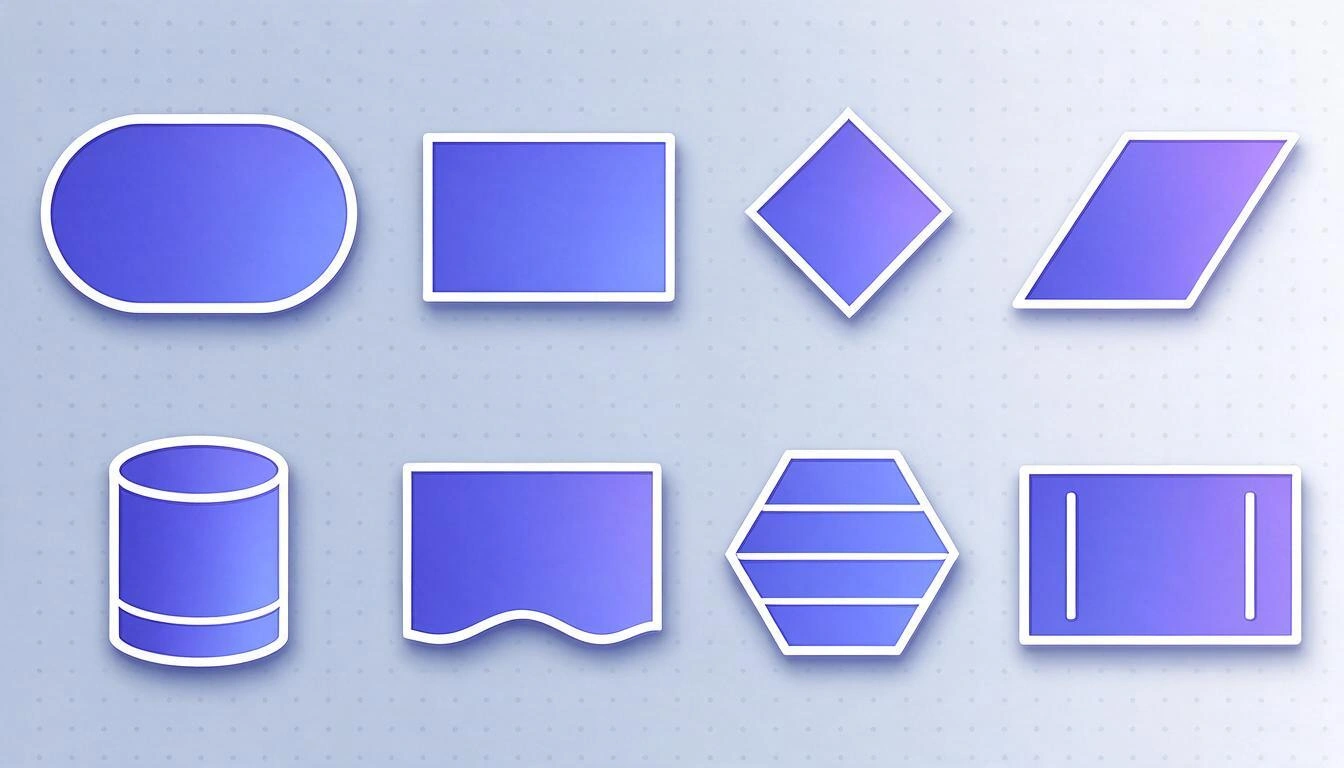
| Shape | Meaning | When to use | Name in FlowBoard | Mermaid |
|---|---|---|---|---|
| Stadium (rounded rectangle) | Terminator | Start and end of the process. One at the beginning, one or more at the end | Terminator | N(["Start"]) |
| Rectangle | Process / operation | An action that changes something: calculate, send, record, review | Rectangle | N["Review order"] |
| Diamond | Decision | A closed question with two or more labeled outputs | Diamond | N{"Is there stock?"} |
| Parallelogram | Data (input/output) | Something enters or leaves the process: a form, a file, a message | Parallelogram | N[/"Form"/] |
| Rectangle with wavy base | Document | A document readable by people: delivery note, report, printed contract | Document | N[/"Delivery note"/] |
| Cylinder | Data storage | Save or read from a database, an ERP, a CRM | Storage | N[("Register in the ERP")] |
| Rectangle with double side line | Predefined process | A subprocess that is already documented in its own diagram | Predefined process | N[["Refund process"]] |
| Hexagon | Preparation | Initialize, configure, or prepare something before the next loop | Hexagon | N{{"Prepare batch"}} |
| Small circle | Connector | Jump to another point in the same diagram without crossing arrows | Ellipse | N(("A")) |
The origin of these shapes is the ANSI X3.5-1970 standard, which influenced the international standard ISO 5807:1985 ("Information processing — Documentation symbols and conventions for data, program and system flowcharts"), which still appears as published in the ISO catalog. No commercial tool implements it to the letter, but the eight shapes above are the common denominator of all: a diagram made with them is understood anywhere.
The shapes that are not flowchart symbols
It is important to know what you are using. FlowBoard offers twelve geometric shapes, but only nine have standardized meanings:
- Triangle and star are not flowchart symbols. They are geometry for schemes, pyramids, or highlights. When exporting to Mermaid, they convert to rectangle and circle respectively, because Mermaid does not have those shapes.
- Rounded rectangle: many tools use it as start/end. The correct symbol for that is the stadium (terminator). If you mix the two, the reader will not know which is which.
- Sticky note: it is a comment, not a step. Use it for questions and pending items ("Who approves this?") never as part of the flow.
The verb rule for naming each block
Processes are named with infinitive verb + object, in three or four words: "Validate document", "Issue label", "Notify customer". No phrases ("The warehouse manager checks if..."): if it doesn't fit in two lines, that block is actually two blocks.
Decisions are named with a closed question that only admits the answers you are going to label: "Is it on time?" with outputs Yes / No. If the question allows three answers, put three outputs and label them all.
The eight rules that separate a readable diagram from a scribble
The difference between a diagram that is understood at a glance and a tangle of arrows is not the drawing: it is the discipline of composition. These eight rules cover almost all cases.

- A single entry. The diagram starts at a single terminator. Multiple entry points mean multiple processes: separate them.
- The flow goes from top to bottom or from left to right, and always in the same direction within the same diagram. Vertical reads better on mobile; horizontal, on a wide screen.
- Every output from a diamond is labeled. An unlabeled arrow coming out of a decision is the number one cause of useless diagrams.
- Each rectangle has an entry and an exit. If a step can end in two ways, what you have there is a hidden diamond.
- Arrows do not cross. If they cross, move the blocks; if they still cross, use the connector symbol (circle) to jump.
- Loops are drawn backward and labeled ("retry", "correct and resend"). An unlabeled backward arrow looks like a drawing error.
- Between 10 and 20 blocks per diagram. Above that, break into subprocesses (see below).
- Blocks align to a grid. It is not aesthetics: alignment is what makes the eye follow the flow effortlessly. In FlowBoard, the grid is 24 px and connectors snap magnetically at 26 px from the edge (40 px when drawing with a finger), so aligning is almost free.
How to create a flowchart step by step
Creating a correct flowchart involves six steps, and the first two are done before drawing anything. The following example is the return of an order in an online store, a process with two decisions and a subprocess: enough to see all the symbols in use.
Step 1 · Set the start and end before anything else
Write the start and end terminators, and leave them on the canvas. Define the trigger ("the customer requests a return") and the outcome ("return closed"). If you can't say where the process ends, you still don't know what you're diagramming.
Step 2 · List the steps in plain text, without shapes
Before touching a figure, write the sequence as a list. It is ten times faster to correct a list than to move boxes. From that list come the blocks:
| Step | Symbol assigned |
|---|---|
| The customer requests a return | Terminator |
| Check the purchase date | Process |
| Is it within the return period? | Decision |
| Return form completed | Data |
| Generate the shipping label | Process |
| Check the status of the item | Process |
| Is the item in good condition? | Decision |
| Record the refund in the ERP | Storage |
| Accounting refund process | Predefined process |
| Notify the customer of the rejection | Process |
| Return closed | Terminator |
Step 3 · Place the blocks and connect from top to bottom
Put the terminator at the top and go down. In FlowBoard, with an element selected, the + button ("add connected node") creates the next block already connected with an arrow and lets you write inside: it is the fastest way to set up the main column without touching the mouse more than necessary.
Step 4 · Label the two outputs of each diamond
From the diamond "Is it within the period?" two arrows come out: Yes towards the form, No towards the rejection notice. From the diamond "Is it in good condition?" come Yes towards the refund record and No towards the same rejection notice. That reuse is correct and also shortens the diagram.
Step 5 · Check the crossings and the orphans
Go through the diagram with your finger from the start. Look for three things: crossing arrows, blocks without an exit, and decisions with a single branch. If a block is not reached from the start, it either has a missing arrow or is unnecessary.
Step 6 · Export and save it where people will read it
A diagram that lives only within the tool is read by no one. Export to PNG to paste it into a document or chat, to SVG if someone will re-edit it in Illustrator or Figma, and to PDF for printing or attaching to a procedure. FlowBoard does all three, plus JSON (reimportable backup) and Mermaid (.mmd), and allows exporting the entire board, just the selection, or a PDF page for each frame.
The shortcut: write the diagram in text and let it draw itself
The quick way is not to draw: it is to write the diagram in Mermaid syntax and let the tool place it. Mermaid is a plain text format for diagrams that GitHub renders natively within Markdown files since February 2022, and that almost all modern tools understand. The entire previous example is written like this:
flowchart TD
    N1(["Customer requests return"])
    N2["Check purchase date"]
    N3{"Is it within the period?"}
    N4[/"Return form"/]
    N5["Generate shipping label"]
    N6["Check status of item"]
    N7{"Is the item in good condition?"}
    N8[("Record refund in ERP")]
    N9[["Accounting refund process"]]
    N10["Notify customer of rejection"]
    N11(["Return closed"])

    N1 --> N2
    N2 --> N3
    N3 -->|"Yes"| N4
    N3 -->|"No"| N10
    N4 --> N5
    N5 --> N6
    N6 --> N7
    N7 -->|"Yes"| N8
    N7 -->|"No"| N10
    N8 --> N9
    N9 --> N11
    N10 --> N11
You paste that text in Import → Paste Mermaid and FlowBoard creates the eleven blocks with their correct shapes, traces the arrows with their labels, and places them in layers automatically: nothing needs to be moved. After that, you can edit whatever you want like on any whiteboard. The reverse also works: Export → Mermaid returns the board code to paste it into a README.
And if you don't feel like writing even that, the AI tab on the board generates the diagram from a description in natural language ("customer onboarding process with document validation and approval"): the AI returns the Mermaid, with a maximum of 25 nodes, and the board draws it. That function consumes tokens from your AIsToHire account, just like the board summary or the automatic grouping of sticky notes by topic.
What is preserved and what is lost when passing through Mermaid
Mermaid is text, so it doesn't retain everything on a whiteboard. This is exactly what happens in FlowBoard:
| Board element | When exporting to Mermaid |
|---|---|
| Rectangle, rounded, diamond, hexagon, parallelogram, cylinder, predefined process, terminator, ellipse | Preserved with their shape |
| Document | Exports as a parallelogram (Mermaid has no document symbol) |
| Triangle | Exports as a rectangle |
| Star | Exports as a circle |
| Sticky note and text | Exports as a rectangle |
| Frames, groups, images, icons, tables, cards, and attachments | Do not export |
| Connectors with one loose end (without elements on both sides) | Do not export |
| Line style, thickness, arrows, and connector labels | Preserved |
| Colors, gradients, rotations, and sizes | Do not export |
When importing, FlowBoard also understands the flag >text] as a document and ignores subgraph, classDef, style, class, and linkStyle: the content comes in, the makeup does not.
When a flowchart is not the right notation
The flowchart is the correct notation for processes with decisions and a single thread of execution. When there are multiple participants in parallel, interrupting events, or hierarchies, there are better notations:
| If what you have is… | The correct notation is… | Reference |
|---|---|---|
| A procedure with decisions, executed by a person or a system | Flowchart | ISO 5807:1985 |
| A business process with multiple participants, messages between them, and interrupting events | BPMN 2.0 (lanes, events, gateways) | OMG, January 2011; adopted as ISO/IEC 19510:2013 |
| The behavior of software with concurrency and objects | UML Activity Diagram | UML 2.5.1, OMG, December 2017 |
| Ideas that still have no order | Mind map or brainstorming with notes | No standard |
| A team or product structure | Organizational chart / tree | No standard |
FlowBoard does not implement BPMN 2.0 or UML as formal notations (there are no lanes, gateways, or notation validation). What it does is provide you with the canvas, shapes, and connectors to draw any of those diagrams by hand, and it comes with 12 ready-made templates —flowchart, organizational chart, mind map, kanban, retrospective, SWOT, priority matrix, empathy map, Business Model Canvas, quarterly roadmap, user journey, and brainstorming—, plus the blank canvas.
What to do when the diagram has become enormous
When a diagram exceeds about twenty blocks, it becomes unreadable: the solution is not to reduce the zoom, but to break it into subprocesses. The block that becomes complex is replaced by a symbol of predefined process, and that subprocess is drawn separately, with its own start and end terminators.

On an infinite whiteboard, there is no need to create a file for each subprocess: frames are used. Each frame is a named page within the same canvas, and in FlowBoard, they serve three specific purposes:
- Organize the board: the frame panel lists them, renames them, rearranges them by dragging, and takes you to any of them with a click.
- Present: presentation mode cycles through the frames in order, one per screen (shortcut
F5). - Export: the PDF can be exported with one page per frame, so the final document is already paginated by subprocesses.
If you still need to see the whole, the zoom can go down to 5% for a bird's eye view, and the mini-map in the corner lets you jump to any area without losing your place.
What FlowBoard does exactly, and what it does not do
FlowBoard is AIsToHire's infinite whiteboard for diagrams, mind maps, and schemes: 12 geometric and flow shapes, sticky notes, text, images, icons, frames, tables, and cards, with magnetic connectors, version history, and export to common formats. To help you decide without surprises, here are its numbers and real limits:
| What | How much |
|---|---|
| Boards per creation | Up to 50 |
| Elements and connectors per board | 1,500 of each (document up to 1.5 MB) |
| Shapes | 12 (8 geometric + 4 flow), plus notes, text, image, icon, frame, table, card, and file |
| Insertable icons | 120 |
| Templates | 12 (plus the blank canvas) |
| Zoom | From 5% to 400% |
| Undo | 60 steps |
| Saved versions per board | 30 (labeled ones do not rotate) |
| Auto-save | Automatic 1.2 s after stopping editing, with retries at 2, 5, and 15 s |
| Imports | Mermaid .mmd, FlowBoard JSON, draw.io .drawio, and Visio .vsdx |
| Exports | PNG, SVG, PDF (one page or one per frame), JSON, and Mermaid .mmd |
| Images and attachments | Images up to 5 MB; attached documents up to 20 MB, 10 per element |
| AI functions | Diagram from text (max. 25 nodes), board summary, group notes by topic, and suggest connections. Consume tokens from the account |
And what it does not do, stated clearly:
- No simultaneous editing. Each board is saved as a complete document; it is not a real-time multiplayer tool. There are comments anchored to each element, with author and resolved status, but two people should not edit the same board at the same time.
- Does not validate notations. It does not check if your BPMN is correct or if the diagram complies with ISO 5807: the shapes are there, the correctness is yours.
- AI does not replace judgment. It generates a draft of up to 25 nodes based on your description; reviewing it is still your job.
The five mistakes that are repeated in all bad diagrams
- Diamonds with a single exit. It is not a decision, it is a process. Change its shape.
- Three-line texts inside blocks. A block with a long sentence is a subprocess that has not been broken down.
- Using the rectangle for everything. If all shapes are the same, the reader has to read 100% of the text to understand the flow; with the correct shapes, they can understand the structure at a glance.
- Arrows with no defined meaning. A line without a point does not indicate what comes first and what comes next. Check that all connectors have an arrow at the correct end.
- Not marking the end. Processes that end "in the air" are processes that in real life no one knows when they are considered closed.
Frequently Asked Questions
What are the basic symbols of a flowchart?
Eight: terminator (oval) for start and end, rectangle for process, diamond for decision, parallelogram for input or output data, document (rectangle with a wavy base), cylinder for data storage, predefined process (rectangle with double side lines) for subprocesses, and circle for connector. With these eight, practically any business process is covered.
What does the diamond mean in a flowchart?
A decision: a closed question whose answers branch the flow. It has one input and two or more outputs, and all outputs must have their label ("Yes", "No", "Amount > 500 €"). If it has only one output, it is not a decision and should be a rectangle.
How many steps should a flowchart have?
Between 10 and 20 blocks per diagram or per frame. Beyond that, it becomes hard to read at a glance: replace the complex piece with a predefined process symbol and draw that subprocess separately, with its own start and end.
Can I create a flowchart from my mobile?
Yes. FlowBoard is designed for mobile: the canvas takes up the entire screen, it scrolls with one finger, zooms with two, and the controls are at the bottom, within thumb reach. The magnetism of the connectors extends to 40 px on touch just so that hooking arrows with your finger is not a lottery.
What is the difference between a flowchart and a BPMN?
The flowchart describes one procedure with decisions, in a single thread. BPMN 2.0 (OMG standard since January 2011, adopted as ISO/IEC 19510:2013) adds lanes by participant, events that interrupt the process, messages between participants, and parallel gateways. If several departments are involved in your process at the same time, BPMN describes reality better. FlowBoard allows you to draw that scheme, but it does not implement BPMN as formal notation nor validate it.
Can I transfer my diagrams from draw.io or Visio to FlowBoard?
Yes. It directly imports .drawio and .vsdx, as well as Mermaid .mmd and the app's own JSON. Shapes that do not have an equivalent are converted into rectangles, and the app will notify you how many there were.
Can I work on the same board with my team at the same time?
No. FlowBoard saves each board as a complete document and does not have simultaneous real-time editing. You can leave comments anchored to each element (with author and resolved status) and recover any of the last 30 saved versions of the board, but parallel work on the same board is not supported.
Do I need to know Mermaid to use FlowBoard?
No. Mermaid is a shortcut, not a requirement: you can draw with the mouse or finger, start from one of the 12 templates, or describe the diagram in a sentence and have the AI generate the code for you. Knowing the syntax only saves you time if you already work with technical documentation in Markdown.
How do I export the diagram to include it in a procedure?
Export to PNG if you are going to paste it into a document or send it via chat, to SVG if someone needs to re-edit it in a vector editor, and to PDF if it goes into a manual, choosing "one page per frame" so that each subprocess occupies its own page. You can also export just the selection instead of the entire board.
FlowBoard, in one sentence
FlowBoard is the infinite whiteboard from AIsToHire for drawing flowcharts, mind maps, and diagrams: twelve shapes, magnetic connectors, 12 templates, import and export of Mermaid, draw.io, and Visio, and output to PNG, SVG, PDF, and JSON. It is available at FlowBoard — Infinite Whiteboard for Diagrams and Ideas. It is not a real-time collaborative editing tool: it is a fast diagram editor that works just as well on mobile as it does on desktop, and your diagram comes out in the format you need.
Open FlowBoard, start from the flowchart template or paste your Mermaid code, and have the process drawn and exported in PNG, SVG, or PDF in ten minutes — from your mobile or computer.
Open FlowBoard, start from the flowchart template or paste your Mermaid code, and have the process drawn and exported in PNG, SVG, or PDF in ten minutes — from your mobile or computer.Keep reading
View all articles →
Mermaid slop: how to review and correct the diagrams generated by AI before publishing them

Why Your Car Insurance Increased in 2026: Average Premium of €1,412 and Historic Record

Discussing via WhatsApp or talking in person: what science says about couple conflicts through messages