 aiToHealth
Out-of-range blood test results: what they really mean (and how to track them over time)
Team at aiToHealthWritten with AI assistance21 min readIn summary
- A reference range does not separate "healthy" from "sick": it is the interval that, by convention, covers the central 95% of a healthy reference population (percentiles 2.5 to 97.5), as defined by the CLSI EP28-A3c guideline, 3rd edition (2008). By design, 1 in 20 healthy people falls outside on each parameter.
- If you measure 20 parameters, the probability that at least one falls outside in a healthy person is around 64% (0.95²⁰ = 0.358). A lone asterisk, by itself, provides little information.
- The same result can be "normal" in one laboratory and marked in another: the units change (5.5 mmol/L of glucose is 99 mg/dL) and the ranges change, which are specific to the method, the analyzer, and the reference population of that center.
- What truly informs is the series, not the point: how much a value fluctuates over consecutive tests and by how much. This requires having the reports together, with the dates clearly indicated and in the same units.
- aiToHealth, the mini app from AIsToHire, handles that mechanical part: it reads the report, recognizes the parameters against a catalog of 88 entries, converts units with a fixed table, and plots the series with its reference band. It does not diagnose, does not interpret for your doctor, and does not replace the official medical record.
It’s 11:40 PM, you have the lab report in hand and there’s a bold number with an arrow next to it. You type it into Google just like that —"ferritin 15 what does it mean"— and in ten minutes you’ve read four forums, a clinic’s website, and an article that leaves you worse off than before. The underlying problem is not that information is lacking: it’s that you lack your own series. That number alone, without the one from a year ago or three years ago, cannot be read well even with the best intentions.
This article explains exactly what a reference range is, why it changes from one laboratory to another, how much a value has to move for the change to mean something, and how to build a family history that truly serves on the day of the consultation. In the end, you will see how aiToHealth, the family medical history of AIsToHire, automates the boring part of all this: reading the report, normalizing names, converting units, and painting the evolution.
Notice. This text is for informational purposes and is not medical advice. It is not intended to diagnose you, rule anything out, or change a treatment. If a result concerns you, what you should do is show it to your doctor or pharmacist, not resolve it online. aiToHealth also does not diagnose: it organizes and explains what is already in your reports.
What does it mean exactly for a value to be "out of range"?
It means that the number falls outside the interval that that laboratory prints beside it, and that interval is a statistical convention: the central 95% of the values measured in a healthy reference population, that is, from the 2.5th to the 97.5th percentile. This is defined by the CLSI EP28-A3c guideline ("Defining, Establishing, and Verifying Reference Intervals in the Clinical Laboratory", 3rd edition, 2008), which is the document that clinical laboratories follow to construct those intervals. It is not the boundary between being healthy and being sick, and certainly not a diagnosis.
From that definition arise three consequences that are almost never mentioned:
- 5% of healthy people fall outside, by design. If the interval covers the central 95%, the remaining 5% —healthy individuals from the reference population itself— fall above or below. Being just outside is statistically the most expected thing in the world.
- The asterisk or arrow is placed by the system, automatically. The laboratory compares your number with its table and marks it. No one has looked at your case when printing that symbol.
- Not all "ranges" are of the same type. In many parameters, it is that population interval, but in others, what appears is a clinical cutoff point agreed upon by scientific consensus (glycated hemoglobin or LDL cholesterol are classic examples). There, the logic is different: it does not describe the population, it marks a decision threshold. Distinguishing one from the other is precisely what your doctor does and not an app.
If you measure 20 parameters, the rare thing is that none come out of range
With a 5% probability of being out of range on each parameter, the interesting question is not "will any come out?", but "how many?". If the parameters were independent of each other, the probability that all fall within is 0.95 raised to the number of measured parameters. A complete blood count with basic biochemistry easily has between 20 and 30 lines.
| Measured Parameters | All within range | At least one out of range |
|---|---|---|
| 1 | 95.0 % | 5.0 % |
| 10 | 59.9 % | 40.1 % |
| 15 | 46.3 % | 53.7 % |
| 20 | 35.8 % | 64.2 % |
| 25 | 27.7 % | 72.3 % |
| 30 | 21.5 % | 78.5 % |
Own calculation based on the 95% convention from CLSI EP28-A3c (2008), assuming independence between parameters. In reality, many are correlated —total cholesterol with LDL, hemoglobin with hematocrit, iron with ferritin— so the actual figure is somewhat lower. The idea, however, holds: in a long panel, seeing some mark is normal.
This does not mean "ignore the asterisks". It means two very specific things: that an isolated mark cannot be read in isolation, and that what distinguishes a relevant finding from statistical noise is how much it deviates, in what direction it moves over time, and in what clinical context it occurs. The first two things you can have organized before entering the consultation. The third is the professional's job.
Why does the same value come out normal in one laboratory and flagged in another?
Because the reports are not directly comparable: the units change, the printed ranges change, and even the name of the parameter changes. A glucose value of 5.5 written in mmol/L is exactly the same as 99 mg/dL, but if you write them together in a spreadsheet, it creates a cliff that doesn't exist.
1. The units. Spain coexists with two systems: the conventional (mg/dL, ng/mL) and the international (mmol/L, µmol/L, nmol/L). These are the most common conversions, with the exact factors applied by the aiToHealth catalog:
| Parameter | Conversion | Factor | Example |
|---|---|---|---|
| Glucose | mmol/L → mg/dL | × 18.016 | 5.5 mmol/L = 99 mg/dL |
| Total cholesterol, LDL and HDL | mmol/L → mg/dL | × 38.67 | 5.2 mmol/L = 201 mg/dL |
| Triglycerides | mmol/L → mg/dL | × 88.57 | 1.7 mmol/L = 151 mg/dL |
| Creatinine | µmol/L → mg/dL | × 0.0113 | 88 µmol/L = 0.99 mg/dL |
| Uric acid | µmol/L → mg/dL | × 0.01681 | 420 µmol/L = 7.1 mg/dL |
| Vitamin D (25-OH) | nmol/L → ng/mL | × 0.4 | 75 nmol/L = 30 ng/mL |
| Hemoglobin | g/L → g/dL | × 0.1 | 140 g/L = 14 g/dL |
| Vitamin B12 | pmol/L → pg/mL | × 1.355 | 221 pmol/L = 299 pg/mL |
| Free T4 | pmol/L → ng/dL | × 0.0777 | 15 pmol/L = 1.17 ng/dL |
| TSH | mUI/L ↔ µUI/mL | × 1 | the same number |
| Ferritin | µg/L ↔ ng/mL | × 1 | the same number |
The last two rows are the friendly trap: TSH and ferritin seem to change units between reports, but in reality, the number is identical.
2. The ranges. The reference interval is specific to the method, the analyzer, and the population of the laboratory that prints it. Two centers can measure the same molecule with different techniques and publish different intervals, and both can be correct. Therefore, the sensible rule when keeping a report is: the range that counts is the one printed on that report, not a generic one you found somewhere.
3. The names. "GPT", "ALT", and "glutamic-pyruvic transaminase" are the same parameter. Just like "GOT" and "AST"; or "glycated hemoglobin", "glycosylated hemoglobin", "HbA1c", and "A1c"; or printer abbreviations like "Tot. Chol." and "Ser. Ferrit.". If you write them down as they come, you end up with three different series of the same thing.
What aiToHealth does with this. Each of the 88 entries in its catalog carries a list of synonyms as written by the laboratories (in Spanish and in English), a fixed table of conversion factors, and ranges by sex and age. The unit conversion is deterministic: it is done by a table, never the language model, and the original value and unit from the report are always preserved alongside the canonical value. The range from the actual report takes priority; the catalog's range only fills in when the report does not provide one. And if the unit is not in the table, the app does not convert haphazardly: it marks the value as "Unknown Unit", highlights it on the review screen, and does not include it in the graph.
How much does a value have to change for the change to mean something?
No parameter is a constant. Between two extractions it fluctuates due to its own intraindividual biological variation, to which is added the analytical imprecision of the method. That’s why a small difference between two reports can be pure noise, and the size of the "noise" depends a lot on the parameter: glycated hemoglobin or hemoglobin are very stable, while TSH, ferritin, serum iron, or transaminases fluctuate quite a bit on their own.
In clinical laboratory this is formalized with the reference change value (reference change value), which combines the biological variation of the analyte and the imprecision of the method to estimate from what difference two consecutive results are truly different. The coefficients of biological variation by analyte are compiled in the EFLM Biological Variation Database of the European Federation of Clinical Chemistry (biologicalvariation.eu, consulted in October 2026). The practical conclusion for someone who is not in the field: the more unstable a parameter is, the greater the change needs to be for it to deserve attention.
aiToHealth applies the same logic with a threshold per parameter to decide when to alert you of a trend:
| Parameters | Minimum accumulated variation to mark trend |
|---|---|
| HbA1c, hemoglobin | 8 % |
| Glucose, total/LDL/HDL cholesterol, glomerular filtration rate (eGFR) | 12 % |
| Creatinine, uric acid | 15 % |
| Triglycerides | 18 % |
| TSH, ferritin, serum iron, vitamin B12, vitamin D | 20 % |
| GOT (AST), GPT (ALT), GGT, PSA | 25 % |
| Rest of the catalog | 15 % by default |
And the trend alert does not trigger for just anything. All four conditions must be met at once:
- There are at least 3 measurements of that parameter in the profile.
- The last 4 all move in the same direction, without intermediate rebounds.
- Those 4 measurements fit within 3 years or less (if they are too far apart in time, it does not count as a trend).
- The accumulated change between the first and the last exceeds the threshold in the table.
If they are met, an alert appears even if the value remains within range —which is precisely the case that slips through when reading isolated reports—. And if a new measurement breaks the streak, the alert resolves itself.
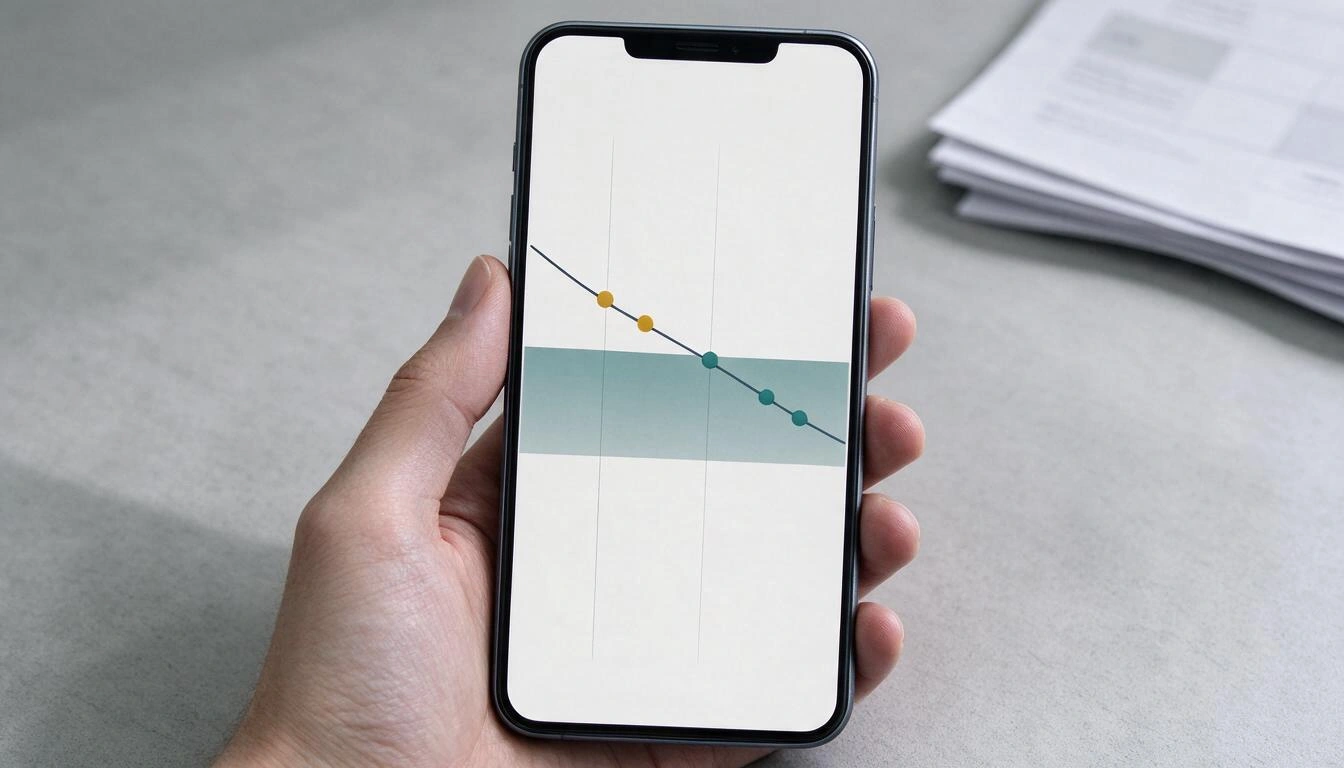
A detail of the graph that is important to understand: the app distinguishes between "attention" and "out of range". If the value exceeds the limit by less than 10 % of the width of the range, it is marked as attention (it is touching); beyond that, it is marked as out of range. It is a presentation convention so that touching the limit does not look the same as shooting up, not a clinical criterion.
How do I set up a historical record that works, in four steps?
With a simple rule: one profile per person, one document per report, and human review before saving anything. This is what aiToHealth does, but the scheme works the same if you set it up manually in a folder and a spreadsheet; what changes is the time it takes.
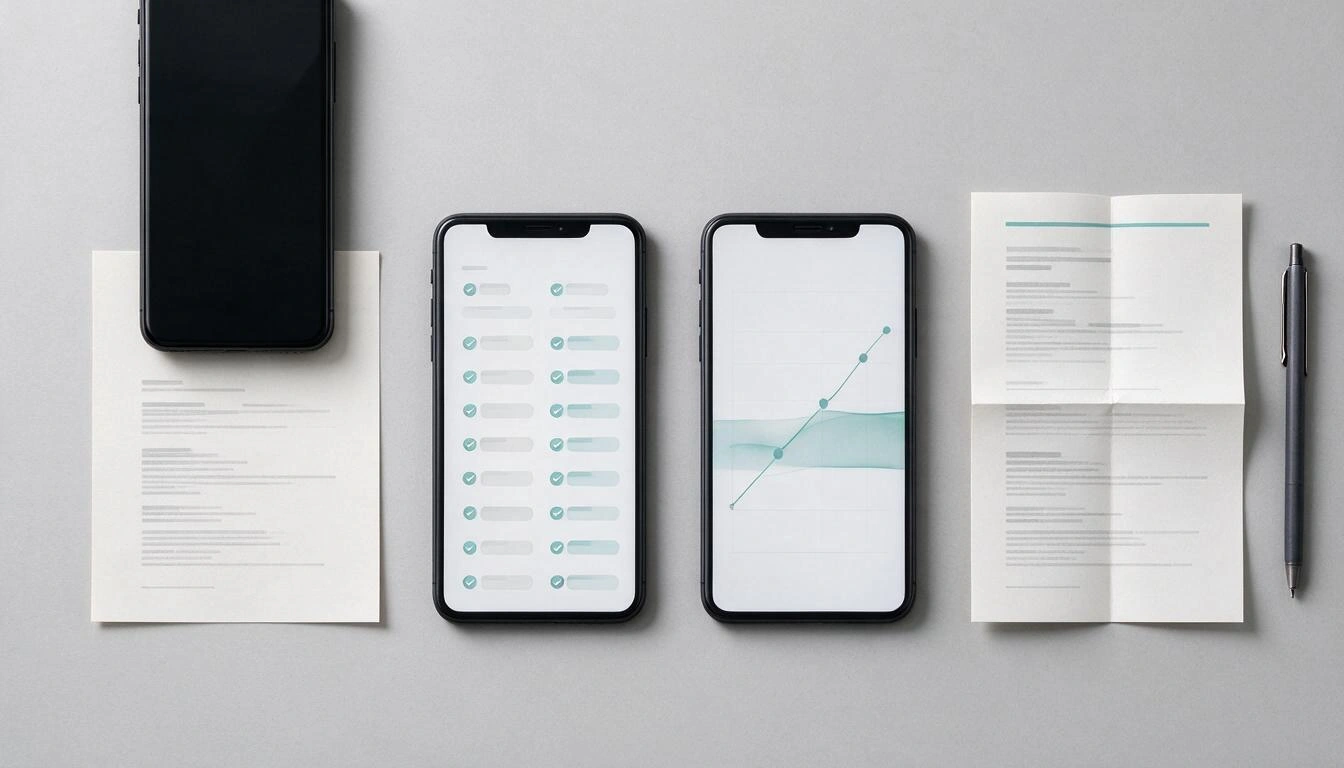
1. One profile per person. Name, date of birth, and sex are not bureaucracy: that’s where the ranges by age and sex come from that are applied only when the report does not provide its own. In aiToHealth, each family member has their color, and everything —graphs, alerts, chat— is filtered by the active profile.
2. Scan the report. Photo, several photos, or the PDF. The app's real limits: up to 10 pages per document and 15 MB per file; images are rescaled to 2,000 px and PDFs are sent whole. The extraction runs in the background, so you can close the screen and come back later. The AI identifies the type of document (blood test, consultation, imaging test, prescription, discharge, emergencies), the date, the center, the doctor, the specialty, and, parameter by parameter, the name as it appears, the value, the unit, the printed range, and whether the laboratory had marked it.
3. Review before saving. This step is not optional and it is the one that prevents a misread number from poisoning your history forever. The review screen puts the doubtful ones at the very top: parameters it could not associate with the catalog, readings with low confidence, and units it does not recognize. You correct what is necessary and confirm. Only then are the measurements created, the comparison with the previous report, the highlights, and the alerts.
4. Look at the series, not the point. With the second blood test of the same parameter, the graph already says something; with the third, the app can start detecting trends. The comparison is calculated against the previous report of the same type by date, not by upload order: you can upload this year's first and then the old ones. Each parameter is classified as better, worse, or stable (with a dead zone so that a minimal variation is not counted as a change), and new parameters are listed along with those that were previously there and no longer appear.
An extra that saves disappointments: if you upload the same report twice —same profile, same date, same center—, the app detects it and warns you that it is a duplicate before you finish with the series counted twice.
What does aiToHealth do and what does it not do?
It does the mechanical and archival part —reading, normalizing, sorting, comparing, remembering, and explaining in clear language—, and leaves the clinical interpretation to professionals. This table is the complete list, without fine print:
| Does do | Does not do |
|---|---|
| Read photos and PDFs of lab results, consultation reports, imaging tests, prescriptions, and discharge summaries | Diagnose, confirm, or rule out a disease |
| Extract each parameter with its value, unit, and printed range, and show it to you so you can correct it before saving | Prescribe, change, or adjust medication or dosage |
| Recognize laboratory synonyms and convert units with a fixed table, always keeping the original value | Replace your official medical history |
| Draw the evolution of each parameter with its reference band and milestones (medication, surgeries, appointments) over the line | Connect with public health, mutual insurance, or laboratories to download your reports |
| Alert of out-of-range values, sustained trends, and pending follow-ups | Read wearables or check if you take your medication |
| Compare each report with the previous one of the same type (better / worse / stable / new / disappeared) | Send native push notifications: reminders go by email and within the app |
| One profile per family member, with each person's history isolated from the rest | Save anything in your history without your confirmation |
| Summarize in clear language and propose specific questions to take to the doctor | Answer general medical questions: the chat only talks about what is in your reports |
| Appointment calendar with email reminders 24 hours and 1 hour before | Prescribe tests or decide if a lab test needs to be repeated |
| One-page summary sheet in PDF to take to the consultation | Share your data with third parties for them to interpret |
Everything generated by the AI is labeled as such in the app itself, and the notice that it is not a diagnosis is accepted once per account.
What do you take to the consultation?
Three specific things, and all three come from what you already have saved. The first is the One-Pager: a one-page PDF with the date of birth and age, sex, blood type, height, last recorded weight, allergies, active medication with its regimen, chronic conditions with their start date, surgeries, vaccines, the latest out-of-range markers with their value, range, and date, open follow-ups, and appointments. It carries a note at the bottom that makes it clear that it was generated by the user from their documents and that it does not replace the official medical history or the assessment of a professional.
The second is the appointment preparation sheet: what to discuss with the doctor, specific questions, relevant data for that specialty (the app knows what areas to look at in cardiology, endocrinology, nephrology, gastroenterology, gynecology, pediatrics, hematology…) and a summary of the last visit to that same specialty. It also carries over the questions that were left pending from previous reports, which are the ones that always get forgotten at the door.
The third comes afterward: upon leaving the consultation, you press the microphone and speak aloud about how it went (up to 3 minutes). The app transcribes and organizes it into what was discussed, treatment, requested tests, next review, and instructions, without adding anything that you did not say. Any pending tests become open follow-ups, which are the ones that then appear in the One-Pager for the next visit.
Why is it worth keeping your own copy?
Because the copy from the center is not eternal and yours is. The Law 41/2002, of November 14, basic regulatory law of patient autonomy (BOE no. 274, of November 15, 2002), obliges in its article 17 to keep clinical documentation "for at least five years counted from the date of discharge of each care process," and recognizes in its article 18 the right of the patient to access their medical history and obtain a copy of their data. Five years is the minimum legal; autonomous communities can extend it, and many centers keep more. But if you have your life split between public health, a mutual insurance, and two private laboratories, no one has your complete history. You can have it.
For practical purposes: request a copy of each report on the day you receive it, save it in digital format with the date and center visible, and keep it yourself. aiToHealth is exactly that —your copy, in your own account—, not access to the official medical history or a connection to any healthcare system.
Checklist: what a stored report must have to be useful in five years
- The date of the extraction or test, not the printing date or the day you saved it.
- The center or laboratory: without it, you cannot explain a strange jump between two reports.
- The unit of each value, literally. A "14" without a unit is worth nothing.
- The printed reference range, the one from that report, even if it seems redundant.
- The marks from the laboratory itself (asterisks, arrows, bold): indicate what that center considered out of range.
- The complete original document, not just the loose numbers: the comments from the physician and the type of sample matter.
- To whom it belongs, if you keep reports from several family members. It is the most common and costly mistake to undo.
Frequently Asked Questions
Does an out-of-range value mean I am sick?
Not necessarily, and in many cases it means nothing by itself. The reference range covers the central 95% of a healthy population, so 5% of healthy people will fall outside each parameter just by statistics. What your specific value means depends on how far it is out, how it has been evolving, what medication you are taking, the situation in which the extraction was done, and your history. That reading is done by a healthcare professional, not an article or an app.
I see an asterisk next to my cholesterol, do I need to see a doctor?
Neither this article nor aiToHealth can answer that: no app can tell you if you need a consultation. What you can do before deciding is to come with organized information: the current value, the two or three previous ones for the same parameter, whether it has been going up or down, what medication you take and since when. With that, the conversation with your family doctor lasts five minutes instead of fifteen.
Why does this year's blood test have different units than last year's?
Because the laboratory has changed, or because the same laboratory has changed its method or unit system (from conventional mg/dL to international mmol/L, for example). The biological value is the same; what changes is the scale in which it is expressed. The only thing you cannot do is put the two numbers in the same column without converting one.
How do I convert from mmol/L to mg/dL?
By multiplying by a factor that depends on the parameter, because it comes from the molecular weight of each substance: glucose × 18.016; total cholesterol, LDL, and HDL × 38.67; triglycerides × 88.57. For creatinine and uric acid, which usually come in µmol/L, the factors are × 0.0113 and × 0.01681. The complete table with examples is further up in this article. In aiToHealth, the conversion is done by a fixed table from the catalog, never the language model, and the original value is always preserved.
Can I combine blood tests from different laboratories in the same graph?
Yes, as long as you convert to a common unit and keep the printed range from each report separately. This is exactly what aiToHealth does: it recognizes the name used by each laboratory, converts the value to the canonical unit of the catalog, and draws the reference band by segments, so the series does not break even if you change centers.
Does aiToHealth tell me what I have?
No, and it is a design decision, not a temporary limitation. The app reads your reports, explains them in clear language, marks what is out of range or has several moving blood tests, and proposes questions to take to the doctor. It does not diagnose, confirm, or rule out diseases, and does not prescribe treatments or doses. Everything generated by the AI is labeled as such within the app.
Can I save my children's and parents' reports in the same account?
Yes: the app is designed for that. Each person has their own profile with their color, health record (allergies, chronic conditions, surgeries, vaccinations, family history, medication), and their history isolated from the rest. The appointments for the whole family are seen in a common calendar, and the chat only crosses data from several people if you expressly activate family mode.
What happens if the AI misreads a number?
You see it and correct it before it enters your history: no value is saved without your confirmation. The review screen first orders the doubtful cases —parameters that it has not been able to associate with the catalog, readings with low confidence, and units it does not recognize— so you do not have to review sixty lines one by one. If you later detect an error, you can confirm the document again and the measurements are recalculated.
Does aiToHealth connect with public health or my insurance?
No. There is no integration with official medical records, public appointment systems, or laboratories. What you save is your copy, uploaded by you from the documents you already have. It also does not read bracelets or activity watches.
What documents can I upload and how many pages?
Photos and PDFs of blood tests, consultation reports, imaging tests, prescriptions, discharge summaries, and emergency reports, with a maximum of 10 pages per document and 15 MB per file. If an blood test has four sheets, all four go in the same document, not four separate documents.
I don't have anything in PDF, just papers in a drawer. Where do I start?
With the most recent report from each person, which is the one that will be most useful for the next consultation, and then go backward when you have a moment. The order of upload does not matter: the comparison is calculated by report date, not by upload order. With two blood tests of the same parameter, you already have a line; with three, the app can start detecting trends.
In a nutshell
aiToHealth is the mini app from AIsToHire that converts the blood tests and medical reports of your entire family into an organized history, with the evolution of each value and appointments in one place; it is at aiToHealth — Family medical history with AI and does not diagnose: it organizes, explains, and prepares you to talk with your doctor.
Organize your family's blood tests with aiToHealth: scan a report and see how each value evolves
Organize your family's blood tests with aiToHealth: scan a report and see how each value evolvesKeep reading
View all articles →
Digital medical record: what reports of yours are not shared between communities (or with the private sector) and how to store them yourself

Discussing via WhatsApp or talking in person: what science says about couple conflicts through messages
Mind map, concept map, and outline: differences and when to use each one